Advertisements
Advertisements
Question
We need ______ coordinates for representing a point on the graph sheet.
Advertisements
Solution
We need pair of (or two) coordinates for representing a point on the graph sheet.
Explanation:
The x coordinate and the y co-ordinate are the two or a pair of point required to plot the point on graph paper.
The distance of point from x-axis makes y co-ordinate and distance of point from y-axis makes x co-ordinate.
APPEARS IN
RELATED QUESTIONS
Locate the points:
(2, 1), (2, 2), (2, 3), (2, 4)
Decide which of the following statements is true and which is false. Give reasons for your answer.
Points whose x and y coordinates are equal, lie on a line passing through the origin.
The distance of any point from the x-axis is called the x-coordinate.
The distance of the point (3, 5) from the y-axis is 5.
From the given graph, choose the letters that indicate the location of the points given below.

- (2, 0)
- (0, 4)
- (5, 1)
- (2, 6)
- (3, 3)
Plot the given points on a graph sheet.
- (5, 4)
- (2, 0)
- (3, 1)
- (0, 4)
- (4, 5)
Write the x-coordinate (abscissa) of the given point.
(7, 3)
Write the x-coordinate (abscissa) of the given point.
(5, 7)
The following is the time-distance graph of Sneha’s walking.

- When does Sneha make the least progress? Explain your reasoning.
- Find her average speed in km/hour.
The two graphs below compare Car A and Car B. The left graph shows the relationship between age and value. The right graph shows the relationship between size and maximum speed.
 |
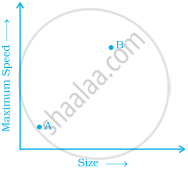 |
Use the graphs to determine whether each statement is true or false, and explain your answer.
- The older car is less valuable.
- The faster car is larger.
- The larger car is older.
- The faster car is older.
- The more valuable car is slower.
