Advertisements
Advertisements
Question
From the given graph, choose the letters that indicate the location of the points given below.

- (2, 0)
- (0, 4)
- (5, 1)
- (2, 6)
- (3, 3)
Advertisements
Solution
On observing the graph, we see that the point F is on X-axis, so its Y-coordinate will be zero.
Also, it is at a distance of 2 units from origin.
... The coordinates of F are (2, 0), similarly the coordinates of G are (4, 0).
H is at a distance of 5 units from Y-axis and 1 unit from X-axis.
... The coordinates of H are (5, 1).
D is at a distance of 6 units from Y-axis and 2 units from X-axis.
... The coordinates of D are (6, 2).
The point D and A are on Y-axis at distances of 2 units and 4 units respectively from the origin.
Hence, the coordinates of D and A are (0, 2) and (0, 4), respectively.
B is at a distance of 1 unit from Y-axis and 5 units from X-axis.
... The coordinates of B are (1, 5).
C is at a distance of 2 units from Y-axis and 6 units from X-axis.
... The coordinates of C are (2, 6).
E is at a distance of 3 units from Y-axis and X-axis both.
... The coordinates of E are (3, 3).
APPEARS IN
RELATED QUESTIONS
Write the coordinates of the vertices of each of these adjoining figures.

State whether True or False. Correct those are false.
A point whose y coordinate is zero and x-coordinate is 5 will lie on y-axis.
Plot the points (5, 0), (5, 1), (5, 8). Do they lie on a line? What is your observation?
The point where the two axes intersect is called the ______.
Match the ordinates of the points given in Column A with the items mentioned in Column B.
| Column A | Column B |
| (a) (7, 0) | (i) The ordinate is double the abscissa. |
| (b) (11, 11) | (ii) The ordinate is zero. |
| (c) (4, 8) | (iii) The ordinate is equal to the abscissa. |
| (d) (6, 2) | (iv) The abscissa is double the ordinate. |
| (e) (0, 9) | (v) The abscissa is triple the ordinate. |
| (f) (6, 3) | (vi) The abscissa is zero. |
The table given below shows the temperatures recorded on a day at different times.

Observe the table and answer the following questions.
- What is the temperature at 8 am?
- At what time is the temperature 3°C?
- During which hour did the temperature fall?
- What is the change in temperature between 7 am and 10 am?
- During which hour was there a constant temperature?
The following is the time-distance graph of Sneha’s walking.

- When does Sneha make the least progress? Explain your reasoning.
- Find her average speed in km/hour.
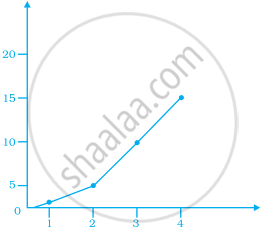
Observe the given graph carefully and complete the table given below.
| x | 1 | 2 | 3 | 4 | 5 |
| y |
The graph given below compares the price (in Rs) and weight of 6 bags (in kg) of sugar of different brands A, B, C, D, E, F.

- Which brand(s) costs/cost more than Brand D?
- Bag of which brand of sugar is the heaviest?
- Which brands weigh the same?
- Which brands are heavier than brand B?
- Which bag is the lightest?
- Which bags are of the same price?
