Advertisements
Advertisements
Question
For fixing a point on the graph sheet we need two coordinates.
Options
True
False
Advertisements
Solution
This statement is True.
Explanation:
To plot a point on the graph sheet we require two numbers, known as coordinates viz. The x-coordinate and the y-coordinate.
APPEARS IN
RELATED QUESTIONS
The following table gives the information regarding length of a side of a square and its area:
| Length of a side (in cm): | 1 | 2 | 3 | 4 | 5 |
| Area of square (in cm2): | 1 | 4 | 9 | 16 | 25 |
Draw a graph to illustrate this information.
In the given graph the letter that indicates the point (0, 3) is ______.

All points with y-coordinate as zero lie on the ______.
The ordinate of a point is its distance from the y-axis.
The y-coordinate of any point lying on the x-axis will be zero.
Study the given map of a zoo and answer the following questions.

- Give the location of lions in the zoo.
- (D, f) and (C, d) represent locations of which animals in the zoo?
- Where are the toilets located?
- Give the location of canteen.
Write the x-coordinate (abscissa) of the given point.
(0, 5)
If y-coordinate is 3 times x-coordinate, form a table for it and draw a graph.
Study the graph given below of a person who started from his home and returned at the end of the day. Answer the questions that follow.

- At what time did the person start from his home?
- How much distance did he travel in the first four hours of his journey?
- What was he doing from 3 pm to 5 pm?
- What was the total distance travelled by him throughout the day?
- Calculate the distance covered by him in the first 8 hours of his journey.
- At what time did he cover 16 km of his journey?
- Calculate the average speed of the man from (a) A to B (b) B to C.
- At what time did he return home?
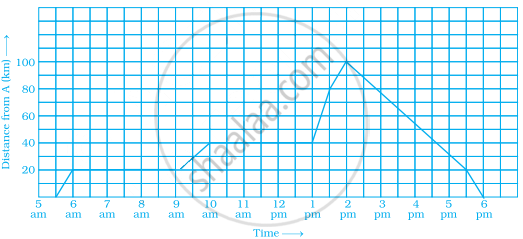
A man started his journey on his car from location A and came back. The given graph shows his position at different times during the whole journey.
- At what time did he start and end his journey?
- What was the total duration of journey?
- Which journey, forward or return, was of longer duration?
- For how many hours did he not move?
- At what time did he have the fastest speed?