Advertisements
Advertisements
प्रश्न
Find the coordinates of points A, B, C, D in Fig. 27.7.

Advertisements
उत्तर
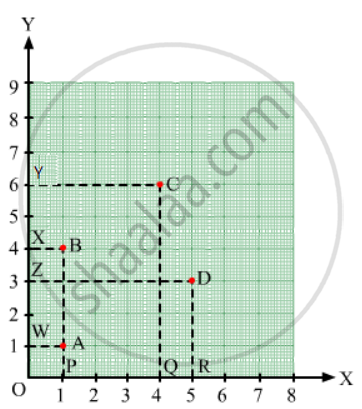
Draw perpendiculars AP, BP, CQ and DR from A, B, C and D on the x-axis. Also, draw perpendiculars AW, BX, CY and DZ on the y-axis.
From the figure, we have:
AW = 1 unit and AP= 1 unit
So, the coordinates of vertex A are (1, 1).
Similarly, BX=1 unit and BP= 4 units
So, the coordinates of vertex B are (1, 4).
CY = 4 units and CQ= 6 units
So, the coordinates of vertex B are (4, 6).
DZ = 5 units and DR= 3 units
So, the coordinates of vertex B are (5, 3).
संबंधित प्रश्न
State whether True or False. Correct those are false.
A point whose y coordinate is zero and x-coordinate is 5 will lie on y-axis.
The point (3, 4) is at a distance of ______.
We need ______ coordinates for representing a point on the graph sheet.
Plot the given points on a graph sheet and check if the points lie on a straight line. If not, name the shape they form when joined in the given order.
(4, 2), (2, 4), (3, 3), (5, 4)
Explain the situations represented by the following distance-time graph.

Explain the situations represented by the following distance-time graph.

Locate the points P(3, 4), Q(1, 0), R(0, 4), S(4, 1) on a graph sheet and write the coordinates of the point of intersection of line segments PQ and RS.
Draw a parallelogram ABCD on a graph paper with the coordinates given in Table I. Use this table to complete Tables II and III to get the coordinates of E, F, G, H and J, K, L, M.
| Point | (x, y) |
| A | (1, 1) |
| B | (4. 4) |
| C | (8, 4) |
| D | (5, 1) |
Table I
| Point | (0.5x, 0.5y) |
| E | (0.5, 0.5) |
| F | |
| G | |
| H |
Table II
| Point | (2x, 1.5y) |
| J | (2, 1.5) |
| K | |
| L | |
| M |
Table III
Draw parallelograms EFGH and JKLM on the same graph paper.
Plot the points (2, 4) and (4, 2) on a graph paper, then draw a line segment joining these two points.
This graph shows the per cent of students who dropped out of school after completing High School. The point labelled A shows that, in 1996, about 4.7% of students dropped out.

- In which year was the dropout the rate highest? In which year was it the lowest?
- When did the per cent of students who dropped out of high school first fall below 5%?
- About what per cent of students dropped out of high school in 2007? About what per cent of students stayed in high school in 2008?
