Advertisements
Advertisements
प्रश्न
Extend the line segment on both sides to meet the coordinate axes. What are the coordinates of the points where this line meets the x-axis and the y-axis?
Advertisements
उत्तर
Let PQ is a line segment which is extened from both ends to meet the axes.
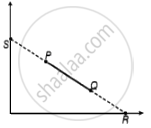
The coordinates of the point on y-axis, where the line segment meet will be of form (0, y) whereas the coordinates of the point of interaction on x-axis will be of type (x, 0).
APPEARS IN
संबंधित प्रश्न
State whether True or False. Correct those are false.
A point whose y coordinate is zero and x-coordinate is 5 will lie on y-axis.
Locate the points:
(1, 1), (1, 2), (1, 3), (1, 4)
Locate the points:
(1, 3), (2, 3), (3, 3), (4, 3)
Write the coordinates of each of the vertices of each polygon in Fig. 27.9.

The following table gives the information regarding the number of persons employed to a piece of work and time taken to complete the work:
| Number of persons: | 2 | 4 | 6 | 8 |
| Time taken (in days): | 12 | 6 | 4 | 3 |
Plot a graph of this information.
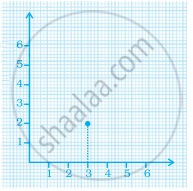
In the given graph the coordinates of point x are ______.
A point has 5 as its x–coordinate and 4 as its y–coordinate. Then the coordinates of the point are given by ______.
Write the x-coordinate (abscissa) of the given point.
(0, 5)
Plot the given points on a graph sheet and check if the points lie on a straight line. If not, name the shape they form when joined in the given order.
(1, 2), (2, 4), (3, 6), (4, 8)
Sonal and Anmol then made another sequence of the designs. Three of the designs are shown below.
 |
 |
 |
(a) Complete the table.
| Rows, r | 4 | 6 | 8 |
| Number of white Tiles, w | 9 | ||
| Number of Purple Tiles, p | 1 |
(b) Draw a graph of rows and number of white tiles. Draw another graph of the number of rows and the number of purple tiles. Put the number of rows on the horizontal axis.
(c) Which graph is linear?
