Advertisements
Advertisements
Question
Draw the line passing through (2, 3) and (3, 2). Find the coordinates of the points at which this line meets the x-axis and y-axis.
Advertisements
Solution
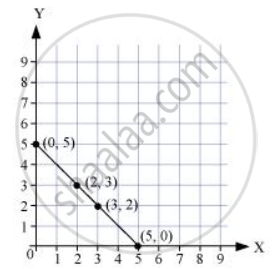
From the graph, it can be observed that the line joining the points (2, 3) and (3, 2) meets the x-axis at the point (5, 0) and the y-axis at the point (0, 5).
RELATED QUESTIONS
Plot the following points on a graph sheet. Verify if they lie on a line
K(2, 3), L(5, 3), M(5, 5), N(2, 5)
Write the coordinates of the vertices of each of these adjoining figures.

Locate the points:
(1, 1), (1, 2), (1, 3), (1, 4)
Find the coordinates of points A, B, C, D in Fig. 27.7.

Match the coordinates given in Column A with the items mentioned in Column B.
| Column A | Column B |
| (1) (0, 5) | (a) y coordinate is 2 × x - coordinate + 1. |
| (2) (2, 3) | (b) Coordinates of origin. |
| (3) (4, 8) | (c) Only y–coordinate is zero. |
| (4) (3, 7) | (d) The distance from x-axis is 5. |
| (5) (0, 0) | (e) y coordinate is double of x-coordinate. |
| (6) (5, 0) | (f) The distance from y-axis is 2. |
Write the x-coordinate (abscissa) of the given point.
(7, 3)
Study the graph given below of a person who started from his home and returned at the end of the day. Answer the questions that follow.

- At what time did the person start from his home?
- How much distance did he travel in the first four hours of his journey?
- What was he doing from 3 pm to 5 pm?
- What was the total distance travelled by him throughout the day?
- Calculate the distance covered by him in the first 8 hours of his journey.
- At what time did he cover 16 km of his journey?
- Calculate the average speed of the man from (a) A to B (b) B to C.
- At what time did he return home?
Draw a parallelogram ABCD on a graph paper with the coordinates given in Table I. Use this table to complete Tables II and III to get the coordinates of E, F, G, H and J, K, L, M.
| Point | (x, y) |
| A | (1, 1) |
| B | (4. 4) |
| C | (8, 4) |
| D | (5, 1) |
Table I
| Point | (0.5x, 0.5y) |
| E | (0.5, 0.5) |
| F | |
| G | |
| H |
Table II
| Point | (2x, 1.5y) |
| J | (2, 1.5) |
| K | |
| L | |
| M |
Table III
Draw parallelograms EFGH and JKLM on the same graph paper.
Plot the points (2, 4) and (4, 2) on a graph paper, then draw a line segment joining these two points.
The graph given below compares the price (in Rs) and weight of 6 bags (in kg) of sugar of different brands A, B, C, D, E, F.

- Which brand(s) costs/cost more than Brand D?
- Bag of which brand of sugar is the heaviest?
- Which brands weigh the same?
- Which brands are heavier than brand B?
- Which bag is the lightest?
- Which bags are of the same price?
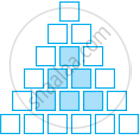
Sonal and Anmol then made another sequence of the designs. Three of the designs are shown below.
 |
 |
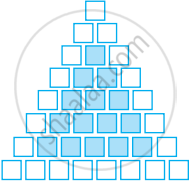 |
(a) Complete the table.
| Rows, r | 4 | 6 | 8 |
| Number of white Tiles, w | 9 | ||
| Number of Purple Tiles, p | 1 |
(b) Draw a graph of rows and number of white tiles. Draw another graph of the number of rows and the number of purple tiles. Put the number of rows on the horizontal axis.
(c) Which graph is linear?
