Advertisements
Advertisements
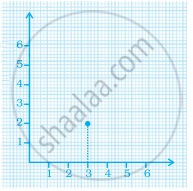
प्रश्न
Plot the given points on a graph sheet.
- (5, 4)
- (2, 0)
- (3, 1)
- (0, 4)
- (4, 5)
Advertisements
उत्तर

APPEARS IN
संबंधित प्रश्न
Locate the points:
(1, 4), (2, 4), (3, 4), (4, 4).
Decide which of the following statements is true and which is false. Give reasons for your answer.
A point whose y-coordinate is zero, will lie on x-axis.
In the given graph the coordinates of point x are ______.
The ordinate of a point is its distance from the y-axis.
The y-coordinate of any point lying on the x-axis will be zero.
Write the y-coordinate (ordinate) of the given point.
(2, 7)
Plot the given points on a graph sheet and check if the points lie on a straight line. If not, name the shape they form when joined in the given order.
(1, 2), (2, 4), (3, 6), (4, 8)
Explain the situations represented by the following distance-time graph.

Find the coordinates of the vertices of the given figures.

Sonal and Anmol then made another sequence of the designs. Three of the designs are shown below.
 |
 |
 |
(a) Complete the table.
| Rows, r | 4 | 6 | 8 |
| Number of white Tiles, w | 9 | ||
| Number of Purple Tiles, p | 1 |
(b) Draw a graph of rows and number of white tiles. Draw another graph of the number of rows and the number of purple tiles. Put the number of rows on the horizontal axis.
(c) Which graph is linear?
