Advertisements
Advertisements
प्रश्न
Plot the following points on a graph sheet. Verify if they lie on a line
A(4, 0), B(4, 2), C(4, 6), D(4, 2.5)
Advertisements
उत्तर
We can plot the given points and join the consecutive points on a graph paper as follows.
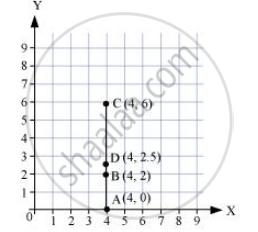
From the graph, it can be observed that the points A, B, C, and D lie on the same line.
संबंधित प्रश्न
Plot the points (5, 0), (5, 1), (5, 8). Do they lie on a line? What is your observation?
Find the coordinates of points A, B, C, D in Fig. 27.7.

The process of fixing a point with the help of the coordinates is known as ______ of the point.
The y-coordinate of the point (2, 4) is ______.
Write the y-coordinate (ordinate) of the given point.
(3, 5)
Explain the situations represented by the following distance-time graph.

Observe the toothpick pattern given below:
(a) Imagine that this pattern continues. Complete the table to show the number of toothpicks in the first six terms.
| Pattern | 1 | 2 | 3 | 4 | 5 | 6 |
| Toothpicks | 4 | 13 |
(b) Make a graph by taking the pattern numbers on the horizontal axis and the number of toothpicks on the vertical axis. Make the horizontal axis from 0 to 10 and the vertical axis from 0 to 30.
(c) Use your graph to predict the number of toothpicks in patterns 7 and 8. Check your answers by actually drawing them.
(d) Would it make sense to join the points on this graph? Explain.
Sonal and Anmol then made another sequence of the designs. Three of the designs are shown below.
 |
 |
 |
(a) Complete the table.
| Rows, r | 4 | 6 | 8 |
| Number of white Tiles, w | 9 | ||
| Number of Purple Tiles, p | 1 |
(b) Draw a graph of rows and number of white tiles. Draw another graph of the number of rows and the number of purple tiles. Put the number of rows on the horizontal axis.
(c) Which graph is linear?
