मराठी

Sonal and Anmol made a sequence of tile designs from square white tiles surrounding one square purple tile. The purple tiles come in many sizes. Three of the designs are shown below. - Mathematics

Advertisements
Advertisements

प्रश्न

Sonal and Anmol made a sequence of tile designs from square white tiles surrounding one square purple tile. The purple tiles come in many sizes. Three of the designs are shown below.

(a) Copy and complete the table

Side Length of Purple Titles 1 2 3 4 5 10 100
Number of white Tiles
in Border
             

(b) Draw a graph using the first five pairs of numbers in your table.

(c) Do the points lie on a line?

तक्‍ता पूर्ण करा
आलेख
Advertisements

उत्तर

(a) In side length 1 the number of white tile surrounding purple tile is 4.

Similarly, in side length 2 the number of white tiles surrounding purple tile is 8.

Thus, we can arrange the following table which shows side length of purple corresponding to the number of white tiles in border.

Side length of purple 1 2 3 4 5 10 100
Number of while titles in border 4 8 12 16 20 40 400

Hence, the table shows y = 8x + 16.

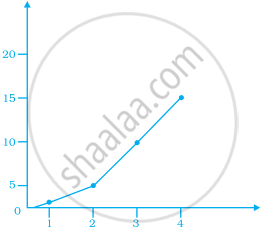
(b) On the basis of tables given in sol. (a) part, we draw the following graph

(c) If we join all points in above graph, we get a straight line. This shows, that all points lies on a line.

shaalaa.com
  या प्रश्नात किंवा उत्तरात काही त्रुटी आहे का?
पाठ 12: Introduct To Graphs - Exercise [पृष्ठ ३९७]

APPEARS IN

एनसीईआरटी एक्झांप्लर Mathematics [English] Class 8
पाठ 12 Introduct To Graphs
Exercise | Q 85. | पृष्ठ ३९७

व्हिडिओ ट्यूटोरियलVIEW ALL [1]

संबंधित प्रश्‍न

State whether True or False. Correct those are false.

A point whose y coordinate is zero and x-coordinate is 5 will lie on y-axis.


Find the coordinates of points ABCD in Fig. 27.7.


A point which lies on both the axis is ______.


The process of fixing a point with the help of the coordinates is known as ______ of the point.


Match the coordinates given in Column A with the items mentioned in Column B.

Column A Column B
(1) (0, 5) (a) y coordinate is 2 × x - coordinate + 1.
(2) (2, 3) (b) Coordinates of origin.
(3) (4, 8) (c) Only y–coordinate is zero.
(4) (3, 7) (d) The distance from x-axis is 5.
(5) (0, 0) (e) y coordinate is double of x-coordinate.
(6) (5, 0) (f) The distance from y-axis is 2.

Write the x-coordinate (abscissa) of the given point.

(5, 7)


Extend the line segment on both sides to meet the coordinate axes. What are the coordinates of the points where this line meets the x-axis and the y-axis?


This graph shows the per cent of students who dropped out of school after completing High School. The point labelled A shows that, in 1996, about 4.7% of students dropped out.

  1. In which year was the dropout the rate highest? In which year was it the lowest?
  2. When did the per cent of students who dropped out of high school first fall below 5%?
  3. About what per cent of students dropped out of high school in 2007? About what per cent of students stayed in high school in 2008?

The points on the graph below represent the height and weight of the donkey, dog, crocodile, and ostrich shown in the drawing.

  1. What are the two variables represented in the graph?
  2. Which point represents each animals? Explain.

The two graphs below compare Car A and Car B. The left graph shows the relationship between age and value. The right graph shows the relationship between size and maximum speed.

Use the graphs to determine whether each statement is true or false, and explain your answer.

  1. The older car is less valuable.
  2. The faster car is larger.
  3. The larger car is older.
  4. The faster car is older.
  5. The more valuable car is slower.

Share
Notifications

Englishहिंदीमराठी


      Forgot password?
Use app×