Advertisements
Advertisements
प्रश्न
Plot the given points on a graph sheet and check if the points lie on a straight line. If not, name the shape they form when joined in the given order.
(1, 1), (1, 2), (2, 1), (2, 2)
Advertisements
उत्तर
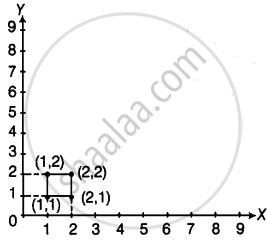
No, the points do not form a straight line, they form a square.
APPEARS IN
संबंधित प्रश्न
Decide which of the following statements is true and which is false. Give reasons for your answer.
A point whose y-coordinate is zero, will lie on x-axis.
The x-coordinate of any point lying on the y-axis will be ______.
For fixing a point on the graph sheet we need two coordinates.
Find the coordinates of all letters in the graph given below.

Plot the given points on a graph sheet.
- (5, 4)
- (2, 0)
- (3, 1)
- (0, 4)
- (4, 5)
Extend the line segment on both sides to meet the coordinate axes. What are the coordinates of the points where this line meets the x-axis and the y-axis?
Ajita starts off from home at 07.00 hours with her father on a scooter that goes at a uniform speed of 30 km/h and drops her at her school after half an hour. She stays in the school till 13.30 hours and takes an auto-rickshaw to return home. The rickshaw has a uniform speed of 10 km/h. Draw the graph for the above situation and also determine the distance of Ajita’s school from her house.
Observe the toothpick pattern given below:
(a) Imagine that this pattern continues. Complete the table to show the number of toothpicks in the first six terms.
| Pattern | 1 | 2 | 3 | 4 | 5 | 6 |
| Toothpicks | 4 | 13 |
(b) Make a graph by taking the pattern numbers on the horizontal axis and the number of toothpicks on the vertical axis. Make the horizontal axis from 0 to 10 and the vertical axis from 0 to 30.
(c) Use your graph to predict the number of toothpicks in patterns 7 and 8. Check your answers by actually drawing them.
(d) Would it make sense to join the points on this graph? Explain.
This graph shows a map of an island just off the coast of a continent. The point labelled B represents a major city on the coast. The distance between grid lines represents 1 km.
Point A represents a resort that is located 5 km East and 3 km North of Point B. The values 5 and 3 are the coordinates of Point A. The coordinates can be given as the ordered pair (5, 3), where 5 is the horizontal coordinate and 3 is the vertical coordinate.
(i) On a copy of the map, mark the point that is 3 km East and 5 km North of Point B and label it S. Is Point S in the water or on the island? Is Point S in the same place as Point A?
(ii) Mark the point that is 7 km east and 5 km north of Point B and label it C. Then mark the point that is 5 km east and 7 km north of Point B and label it D. Are Points C and D in the same place? Give the coordinates of Points C and D.
(iii) Which point is in the water, (2, 7) or (7, 2)? Mark the point which is in water on your map and label it E.
(iv) Give the coordinates of two points on the island that are exactly 2 km from Point A.
(v) Give the coordinates of the point that is halfway between Points L and P.
(vi) List three points on the island with their x-coordinates greater than 8.
(vii) List three points on the island with a y-coordinate less than 4.
