Advertisements
Advertisements
प्रश्न
Plot the following points on a graph sheet. Verify if they lie on a line
K(2, 3), L(5, 3), M(5, 5), N(2, 5)
Advertisements
उत्तर
We can plot the given points and join the consecutive points on a graph paper as follows.
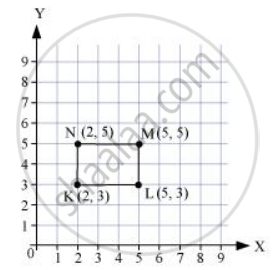
Hence, points K, L, M, and N are not lying on the same line.
संबंधित प्रश्न
Find the coordinates of points P, Q, R and S in Fig. 27.8.

Decide which of the following statement is true and which is false. Give reasons for your answer.
A point whose x-coordinate is zero, will lie on the y-axis.
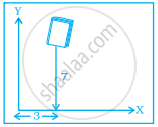
In the given figure the position of the book on the table may be given by ______.
The y-coordinate of the point (2, 4) is ______.
In the point (4, 7), 4 denotes the ______.
Match the coordinates given in Column A with the items mentioned in Column B.
| Column A | Column B |
| (1) (0, 5) | (a) y coordinate is 2 × x - coordinate + 1. |
| (2) (2, 3) | (b) Coordinates of origin. |
| (3) (4, 8) | (c) Only y–coordinate is zero. |
| (4) (3, 7) | (d) The distance from x-axis is 5. |
| (5) (0, 0) | (e) y coordinate is double of x-coordinate. |
| (6) (5, 0) | (f) The distance from y-axis is 2. |
Write the y-coordinate (ordinate) of the given point.
(4, 0)
Explain the situations represented by the following distance-time graph.

Explain the situations represented by the following distance-time graph.

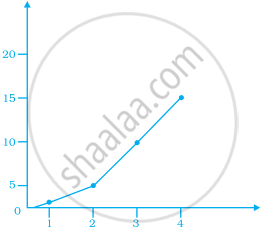
Observe the given graph carefully and complete the table given below.
| x | 1 | 2 | 3 | 4 | 5 |
| y |