मराठी

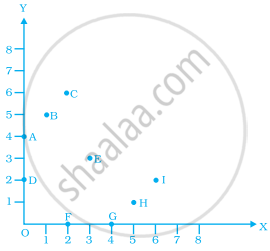
The point where the two axes intersect is called the ______.

Advertisements
Advertisements

प्रश्न

The point where the two axes intersect is called the ______.

रिकाम्या जागा भरा
Advertisements

उत्तर

The point where the two axes intersect is called the origin.

Explanation:

The x-axis and y-axis intersect each other at the point representing the origin. Coordinates of origin are (0, 0).

shaalaa.com
  या प्रश्नात किंवा उत्तरात काही त्रुटी आहे का?
पाठ 12: Introduct To Graphs - Exercise [पृष्ठ ३७६]

APPEARS IN

एनसीईआरटी एक्झांप्लर Mathematics Exemplar [English] Class 8
पाठ 12 Introduct To Graphs
Exercise | Q 25. | पृष्ठ ३७६

व्हिडिओ ट्यूटोरियलVIEW ALL [1]

संबंधित प्रश्‍न

Plot the points (5, 0), (5, 1), (5, 8). Do they lie on a line? What is your observation?


In the given graph the letter that indicates the point (0, 3) is ______.


We need ______ coordinates for representing a point on the graph sheet.


For fixing a point on the graph sheet we need two coordinates.


Explain the situations represented by the following distance-time graph.


Explain the situations represented by the following distance-time graph.


Find the coordinates of the vertices of the given figures.


The graph given below compares the sales of ice creams of two vendors for a week.


Observe the graph and answer the following questions.

  1. Which vendor has sold more icecreams on Friday?
  2. For which day was the sales same for both the vendors?
  3. On which day did the sale of vendor A increase the most as compared to the previous day?
  4. On which day was the difference in sales the maximum?
  5. On which two days was the sales same for vendor B?

The graph given below compares the price (in Rs) and weight of 6 bags (in kg) of sugar of different brands A, B, C, D, E, F.

  1. Which brand(s) costs/cost more than Brand D?
  2. Bag of which brand of sugar is the heaviest?
  3. Which brands weigh the same?
  4. Which brands are heavier than brand B?
  5. Which bag is the lightest?
  6. Which bags are of the same price?

The two graphs below compare Car A and Car B. The left graph shows the relationship between age and value. The right graph shows the relationship between size and maximum speed.

Use the graphs to determine whether each statement is true or false, and explain your answer.

  1. The older car is less valuable.
  2. The faster car is larger.
  3. The larger car is older.
  4. The faster car is older.
  5. The more valuable car is slower.

Share
Notifications

Englishहिंदीमराठी


      Forgot password?
Use app×