Advertisements
Advertisements
प्रश्न
Locate the points A(1, 2), B(3, 4) and C(5, 2) on a graph sheet taking suitable axes. Write the coordinates of the fourth point D to complete the rhombus ABCD. Measure the diagonals of this rhombus and find whether they are equal or not.
Advertisements
उत्तर
Given points are A(1, 2), B(3, 4) and C(5, 2).
Location of given points on the graph given below.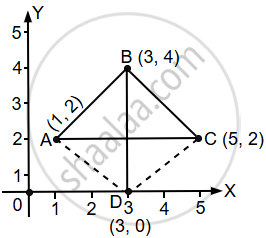
To complete the rhombus the fourth point will be (3, 0).
∴ The Length of the diagonals, AC = BD = 4 units and they are equal.
APPEARS IN
संबंधित प्रश्न
The following table gives the information regarding the number of persons employed to a piece of work and time taken to complete the work:
| Number of persons: | 2 | 4 | 6 | 8 |
| Time taken (in days): | 12 | 6 | 4 | 3 |
Plot a graph of this information.
For the point (5, 2), the distance from the x-axis is ______ units.
The distance of the point (3, 5) from the y-axis is 5.
Write the x-coordinate (abscissa) of the given point.
(5, 7)
Write the y-coordinate (ordinate) of the given point.
(2, 7)
Make a line graph for the area of a square as per the given table.
| Side (in cm) | 1 | 2 | 3 | 4 |
| Area (in cm2) | 1 | 4 | 9 | 16 |
Is it a linear graph?
The following table gives the growth chart of a child.
| Height (in cm) | 75 | 90 | 110 | 120 | 130 |
| Age (in years) | 2 | 4 | 6 | 8 | 10 |
Draw a line graph for the table and answer the questions that follow.
- What is the height at the age of 5 years?
- How much taller was the child at the age of 10 than at the age of 6?
- Between which two consecutive periods did the child grow more faster?
Draw a parallelogram ABCD on a graph paper with the coordinates given in Table I. Use this table to complete Tables II and III to get the coordinates of E, F, G, H and J, K, L, M.
| Point | (x, y) |
| A | (1, 1) |
| B | (4. 4) |
| C | (8, 4) |
| D | (5, 1) |
Table I
| Point | (0.5x, 0.5y) |
| E | (0.5, 0.5) |
| F | |
| G | |
| H |
Table II
| Point | (2x, 1.5y) |
| J | (2, 1.5) |
| K | |
| L | |
| M |
Table III
Draw parallelograms EFGH and JKLM on the same graph paper.
Plot the points (2, 4) and (4, 2) on a graph paper, then draw a line segment joining these two points.
The points on the graph below represent the height and weight of the donkey, dog, crocodile, and ostrich shown in the drawing.
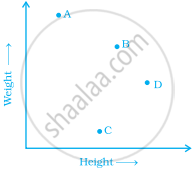
- What are the two variables represented in the graph?
- Which point represents each animals? Explain.
