Advertisements
Advertisements
Question
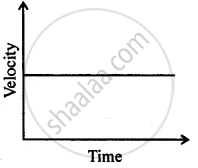
Can you suggest a real-life example about the motion of a body from the following velocity – time graph?
Advertisements
Solution
A car running on a road at a constant velocity. Then v – t graph will be same as shown by

APPEARS IN
RELATED QUESTIONS
Name the quantity which is measured by the area occupied under the velocity-time graph.
Find the initial velocity of a car which is stopped in 10 seconds by applying brakes. The retardation due to brakes is 2.5 m/s2.
A cheetah starts from, rest, and accelerates at 2 m/s2 for 10 seconds. Calculate :
(a) the final velocity
(b) the distance travelled.
A freely falling object travels 4.9 m in 1st second, 14.7 m in 2 nd second, 24.5 m in 3rd second, and so on. This data shows that the motion of a freely falling object is a case of :
Give one example of following motion :
Variable acceleration
When is the negative acceleration?
Multiple choice Question. Select the correct option.
At the maximum height, a body thrown vertically upwards has :
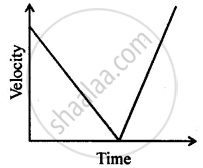
Can you suggest a real-life example about the motion of a body from the following velocity – time graph?
A packet is dropped from a stationary helicopter, hovering at a height ‘h’ from ground level, reaches the ground in 12s. Calculate
- the value of h
- final velocity of packet on reaching the ground. (Take g = 9.8 ms−2)
The velocity-time graph (Fig. 8.5) shows the motion of a cyclist. Find (i) its acceleration (ii) its velocity and (iii) the distance covered by the cyclist in 15 seconds.

