Advertisements
Advertisements
Multiple choice Question. Select the correct option.
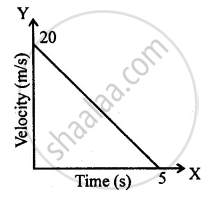
In the velocity-time graph, the acceleration is
Concept: undefined >> undefined
Multiple choice Question. Select the correct option.
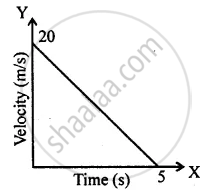
The distance covered in the adjoining velocity-time graph is :
Concept: undefined >> undefined
Advertisements
Draw displacement – time graph for the following situation:
When a body is stationary.
Concept: undefined >> undefined
Draw velocity – time graph for the following situation:
When a body, is moving with uniform velocity.
Concept: undefined >> undefined
Draw velocity – time graph for the following situation:
When a body is moving with variable velocity, but uniform acceleration.
Concept: undefined >> undefined
Diagram shows a velocity – time graph for a car starting from rest. The graph has three sections AB, BC and CD.

From a study of this graph, state how the distance travelled in any section is determined.
Concept: undefined >> undefined
Diagram shows a velocity – time graph for a car starting from rest. The graph has three sections AB, BC and CD.
Compare the distance travelled in section BC with the distance travelled in section AB.
Concept: undefined >> undefined
Diagram shows a velocity – time graph for a car starting from rest. The graph has three sections AB, BC, and CD.
In which section, car has a zero acceleration?
Concept: undefined >> undefined
Diagram shows a velocity – time graph for a car starting from rest. The graph has three sections AB, BC, and CD.
Is the magnitude of acceleration higher or lower than that of retardation? Give a reason.
Concept: undefined >> undefined
A train starting from rest picks up a speed of 20 ms−1 in 200 s. It continues to move at the same rate for the next 500 s and is then brought to rest in another 100 s.
- Plot a speed-time graph.
- From graph calculate
(a) uniform rate of acceleration
(b) uniform rate of retardation
(c) total distance covered before stopping
(d) average speed.
Concept: undefined >> undefined
A ball is thrown up vertically and returns back to thrower in 6 s. Assuming there is no air friction, plot a graph between velocity and time. From the graph calculate
- deceleration
- acceleration
- total distance covered by ball
- average velocity.
Concept: undefined >> undefined
A body at rest is thrown downward from the top of the tower. Draw a distance – time graph of its free fall under gravity during the first 3 seconds. Show your table of values starting t = 0 with an interval of 1 second, (g = 10 ms−2).
Concept: undefined >> undefined
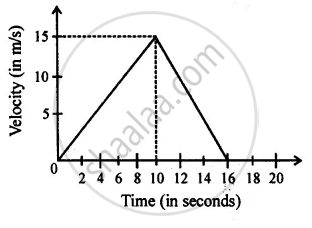
From the diagram given below, calculate distance covered by body.
Concept: undefined >> undefined
From the velocity – time graph given below, calculate acceleration in the region AB.

Concept: undefined >> undefined
From the velocity – time graph given below, calculate Distance covered in the region ABCE.
Concept: undefined >> undefined
From the velocity – time graph given below, calculate Average velocity in region CED.
Concept: undefined >> undefined
Diagram is given below shows velocity – time graph of car P and Q, starting from the same place and in the same direction. Calculate at what time intervals both cars have the same velocity?

Concept: undefined >> undefined
Diagram is given below shows velocity – time graph of car P and Q, starting from the same place and in the same direction. Calculate which car is ahead after 10 s and by how much?
Concept: undefined >> undefined
