Topics
Laws of Motion
- Force and Motion
- Distance and Displacement
- Speed and Velocity
- Effect of Speed and Direction on Velocity
- Uniform and Non-uniform Motion
- Acceleration and Retardation
- Types of Acceleration
- Graphical Representation of Motion
- Displacement - Time Graph Or Distance - Time Graph
- Velocity - Time Graphs
- Equations of Motion by Graphical Method
- Derivation of Velocity - Time Relation by Graphical Method
- Derivation of Displacement - Time Relation by Graphical Method
- Derivation of Displacement - Velocity Relation by Graphical Method
- Uniform Circular Motion (UCM)
- Newton’s Laws of Motion
- Newton's First Law of Motion
- Newton’s Second Law of Motion
- Newton's Third Law of Motion
- Conservation of Linear Momentum and Its Principle
Work and Energy
Current Electricity
- Electricity
- Potential Difference
- Free Electrons
- Electric Current
- Ohm's Law
- Resistance and Resistivity of a Conductor
- Electric Circuit
- Symbols and Functions of Various Components of an Electric Circuits
- Electrical Conduction in Solids
- Experimental Verification of Ohm’s Law and Ohmic Resistors
- Resistance of a System of Resistors
- Resistors in Series
- Resistors in Parallel
- Domestic Electrical Connections
- Precautions to Be Taken While Using Electricity
Measurement of Matter
- Laws of Chemical Combination
- Law of Conservation of Matter (Law of Conservation of Mass)
- Law of Constant Proportions (Law of Definite Proportions)
- Atoms: Building Blocks of Matter
- Atomic Mass
- Symbols Used to Represent Atoms of Different Elements
- Molecules of Elements and Compounds
- Molecular Mass
- Mole Concept
- Avogadro's Number
- Periodic Trends in the Modern Periodic Table
- Variable Valency
- Ions (Radicals) and Its Types
- Chemical Formulae of Compounds
Acids, Bases and Salts
- Concept of Acid, Base, and Salt
- Ionic Compounds
- Dissociation of Ionic Compounds
- Arrhenius Theory of Acids and Bases
- Basicity and Acidity
- Ph of Solution
- Indicators
- Neutralization Reaction
- Reactions of Acids
- Reactions of Bases
- Salts
- Classification of Salts
- Water of Crystallization
- Electrolysis
- Electrolysis of Water
Classification of Plants
Energy Flow in an Ecosystem
Useful and Harmful Microbes
Environmental Management
- Weather and Climate
- Importance of Weather in the Living World
- Meteorology
- India Meteorological Department
- Solid Waste Management
- Waste and Its Categories
- Waste
- Harmful effects of solid waste
- Necessity of Solid Waste Management
- 7 Principles of Solid Waste Management
- Period Required for Degradation of Waste
- Disaster Management
- First Aid and Emergency Action
- Methods of Transporting Victims/Patients Safely
Information Communication Technology
- What is Information and Communication Technology ?
- Introduction to Computer
- Parts of Computer and Its Functions
- Architecture of Computer
- Computer Hardware and Software
- Microsoft Word
- Microsoft Excel
- Microsoft Powerpoint
- Applications of Technology in Science
- Opportunities in the field of computers
Reflection of Light
- Introduction to Light
- Mirrors
- Plane Mirror
- Spherical Mirrors
- Spherical Mirror > Concave Mirror
- Spherical Mirror > Convex Mirror
- Fundamental Terms Related to Spherical Mirrors
- Rules for Drawing Ray Diagrams
- Image Formation by Concave Mirror
- Image Formation by Convex Mirror
- Divergence and Convergence of Light
- Sign Convention
- Ray Optics - Mirror Formula
- Linear Magnification by Spherical Mirrors
Study of Sound
Carbon : An Important Element
- Carbon: A Versatile Element
- Straight chains, Branched chains, and Rings of Carbon atoms
- Allotropes of Carbon > Diamond
- Allotropes of Carbon > Diamond
- Allotropes of Carbon > Graphite
- Allotropes of Carbon > Fullerene
- Non-crystalline/Amorphous Forms: Coal
- Non-crystalline/Amorphous Forms: Charcoal
- Hydrocarbons
- Non-crystalline/Amorphous Forms: Coke
- Solubility of Carbon
- Reaction of Carbon
- Carbon Dioxide
- Fire Extinguisher
- Methane
- Biogas Plant
Substances in Common Use
- Important Salts in Daily Life
- Properties and Uses of Sodium Chloride
- Preparation and Uses of Baking Soda
- Preparation and Uses of Bleaching Powder
- Preparation and Uses of Washing Soda
- Some Crystalline Salts
- Soap
- Radioactivity
- Nature of Radioactive Radiation
- Characteristics of Alpha, Beta and Gamma Rays
- Uses of Radioactive Isotopes
- Harmful Effects of Radiation
- Chemical Substances in Day to Day Life
- Food Colours and Essences
- Dye
- Artificial Colours
- Deodorant
- Teflon
- Powder Coating
- Anodizing
- Ceramic
Life Processes in Living Organisms
- Transportation in Living Organisms
- Transportation in Plants
- Transportation of Water
- Transportation of Food and Other Substances
- Excretion
- Excretion in Plants
- Human Excretory System
- Dialysis and Artificial Kidney
- Need for Control and Coordination in Organisms
- Control and Co-ordination in Plants
- Control and Co-ordination in Human Being
- Nervous Control
- Human Nervous System
- Central Nervous System (CNS)
- Chemical Control
- Endocrine Glands: Location and Important Functions
Heredity and Variation
- Inherited Traits and Expression of Traits
- Chromosomes - The Carriers of Heredity
- Types of Chromosomes
- Deoxyribonucleic Acid (DNA)
- Ribonucleic acid (RNA)
- Gregor Johann Mendel – Father of Genetics
- Monohybrid Cross
- Dihybrid Cross
- Human Genetic Disorders
- Diseases Occuring Due to Mutation in Single Gene (Monogenic Disorders)
- Mitochondrial Disorder
- Disorders Due to Mutations in Multiple Genes : (Polygenic Disorders)
Introduction to Biotechnology
- Tissues - “The Teams of Workers”
- Animal Tissues
- Epithelial Tissue
- Connective Tissue
- Muscular Tissue
- Nervous Tissue
- Plant Tissues
- Meristems or Meristematic Tissues
- Permanent Tissue
- Simple Permanent Tissues (Supporting Tissue)
- Complex Permanent Tissues
- Tissue Culture
- Changes in Agricultural Management Due to Biotechnology
- Application of Biotechnology in Floriculture, Nurseries and Forestry
- Agritourism
- Animal Husbandry (Livestock)
- Animal Husbandry (Livestock) > Poultry Farm Management
- Animal Husbandry (Livestock) > Sericulture
Observing Space : Telescopes
- Introduction
- Steps to Create a Graph and Analyze Data in Microsoft Excel
- Data Entry Precautions in Microsoft Excel
Introduction
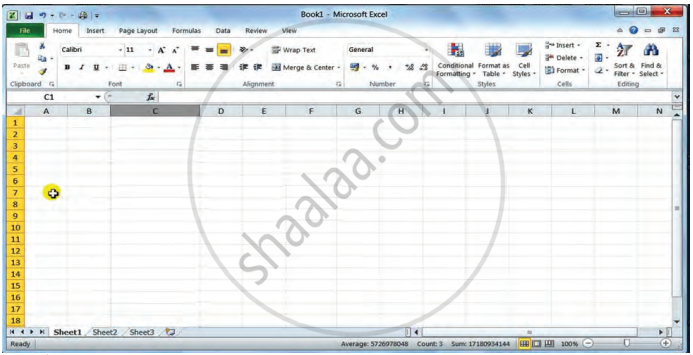
Microsoft Excel is a powerful spreadsheet software developed by Microsoft, available on Windows, macOS, Android, iOS, and iPadOS. It is part of the Microsoft Office and Microsoft 365 suites and has been in continuous development since 1985. Excel provides tools for data organisation, calculation, and analysis using a grid of cells arranged in numbered rows and letter-named columns. The software features calculation capabilities, graphing tools, pivot tables, and supports macro programming through Visual Basic for Applications (VBA). It includes built-in functions to address statistical, engineering, and financial needs, allowing users to perform complex calculations with ease.
Excel also enables the creation of line graphs, histograms, charts, and basic 3D graphical displays for data visualisation. Widely used in fields like business, education, and finance, Microsoft Excel simplifies tasks such as data entry, budgeting, and statistical analysis. Its user-friendly interface, combined with its robust tools, makes it essential for managing large datasets, analysing information, and creating professional charts and reports.
Steps to Create a Graph and Analyze Data in Microsoft Excel
- Opening Microsoft Excel: Click on the Microsoft Excel icon on the desktop or search for it in the Start menu.
- Creating a New Worksheet: Go to the ‘File’ tab, select ‘New,’ and then click on ‘Blank’ to open a new sheet.
- Entering Data: Type the numerical information to be used for drawing the graph in the worksheet. Enter data neatly and in a tabular form, keeping different types of data in separate cells.
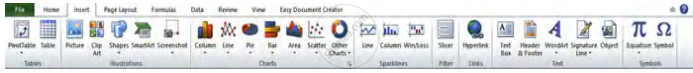
- Drawing a Graph: After typing the data, select the information that needs to be represented as a graph. Go to the ‘Insert’ tab and choose the required graph type (e.g., column, line, pie, bar) from the chart options.
- Analysing Data: Use the graph to analyse and interpret the information visually.
Data Entry Precautions in Microsoft Excel
- Keep data in a tabular format for clarity and accuracy.
- Enter different types of data in separate cells to avoid confusion.
- Type data in one flow, avoiding unnecessary spaces or special characters.
- Use the drag-and-fill feature carefully: After dragging data, use the ‘smart tag’ to customise the data fill as needed.
- For calculations, type formulas correctly: Begin any formula with the ‘=’ sign.
- Avoid inserting spaces within formulas.
Related QuestionsVIEW ALL [2]
Using a spreadsheet, draw graphs between distance and time, using the information about the movements of Amar, Akbar and Anthony given in the table below in the lesson on the Laws of Motion. What precautions will you take while drawing the graph?
| Time in the clock | Distance covered by Amar in km. |
Distance covered by Akbar in km. |
Distance covered by Anthony in km. |
| 5.00 | 0 | 0 | 0 |
| 5.30 | 20 | 18 | 14 |
| 6.00 | 40 | 36 | 28 |
| 6.30 | 60 | 42 | 42 |
| 7.00 | 80 | 70 | 56 |
| 7.30 | 100 | 95 | 70 |
| 8.00 | 120 | 120 | 84 |
