Advertisements
Advertisements
Explain the situations represented by the following distance-time graph.

Concept: undefined >> undefined
Find the coordinates of the vertices of the given figures.

Concept: undefined >> undefined
Advertisements
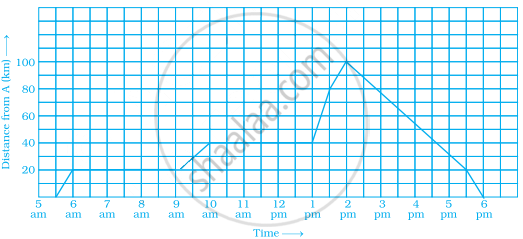
Study the graph given below of a person who started from his home and returned at the end of the day. Answer the questions that follow.

- At what time did the person start from his home?
- How much distance did he travel in the first four hours of his journey?
- What was he doing from 3 pm to 5 pm?
- What was the total distance travelled by him throughout the day?
- Calculate the distance covered by him in the first 8 hours of his journey.
- At what time did he cover 16 km of his journey?
- Calculate the average speed of the man from (a) A to B (b) B to C.
- At what time did he return home?
Concept: undefined >> undefined
Locate the points A(1, 2), B(4, 2) and C(1, 4) on a graph sheet taking suitable axes. Write the coordinates of the fourth point D to complete the rectangle ABCD.
Concept: undefined >> undefined
Locate the points A(1, 2), B(3, 4) and C(5, 2) on a graph sheet taking suitable axes. Write the coordinates of the fourth point D to complete the rhombus ABCD. Measure the diagonals of this rhombus and find whether they are equal or not.
Concept: undefined >> undefined
Locate the points P(3, 4), Q(1, 0), R(0, 4), S(4, 1) on a graph sheet and write the coordinates of the point of intersection of line segments PQ and RS.
Concept: undefined >> undefined
The graph given below compares the sales of ice creams of two vendors for a week.
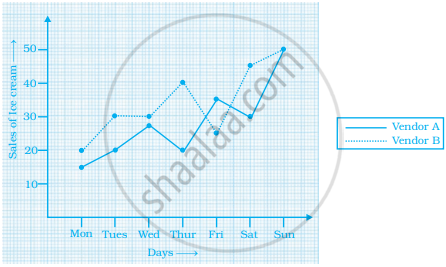
Observe the graph and answer the following questions.
- Which vendor has sold more icecreams on Friday?
- For which day was the sales same for both the vendors?
- On which day did the sale of vendor A increase the most as compared to the previous day?
- On which day was the difference in sales the maximum?
- On which two days was the sales same for vendor B?
Concept: undefined >> undefined
The table given below shows the temperatures recorded on a day at different times.

Observe the table and answer the following questions.
- What is the temperature at 8 am?
- At what time is the temperature 3°C?
- During which hour did the temperature fall?
- What is the change in temperature between 7 am and 10 am?
- During which hour was there a constant temperature?
Concept: undefined >> undefined
The following table gives the growth chart of a child.
| Height (in cm) | 75 | 90 | 110 | 120 | 130 |
| Age (in years) | 2 | 4 | 6 | 8 | 10 |
Draw a line graph for the table and answer the questions that follow.
- What is the height at the age of 5 years?
- How much taller was the child at the age of 10 than at the age of 6?
- Between which two consecutive periods did the child grow more faster?
Concept: undefined >> undefined
The following is the time-distance graph of Sneha’s walking.

- When does Sneha make the least progress? Explain your reasoning.
- Find her average speed in km/hour.
Concept: undefined >> undefined
Draw a parallelogram ABCD on a graph paper with the coordinates given in Table I. Use this table to complete Tables II and III to get the coordinates of E, F, G, H and J, K, L, M.
| Point | (x, y) |
| A | (1, 1) |
| B | (4. 4) |
| C | (8, 4) |
| D | (5, 1) |
Table I
| Point | (0.5x, 0.5y) |
| E | (0.5, 0.5) |
| F | |
| G | |
| H |
Table II
| Point | (2x, 1.5y) |
| J | (2, 1.5) |
| K | |
| L | |
| M |
Table III
Draw parallelograms EFGH and JKLM on the same graph paper.
Plot the points (2, 4) and (4, 2) on a graph paper, then draw a line segment joining these two points.
Concept: undefined >> undefined
Extend the line segment on both sides to meet the coordinate axes. What are the coordinates of the points where this line meets the x-axis and the y-axis?
Concept: undefined >> undefined
A man started his journey on his car from location A and came back. The given graph shows his position at different times during the whole journey.
- At what time did he start and end his journey?
- What was the total duration of journey?
- Which journey, forward or return, was of longer duration?
- For how many hours did he not move?
- At what time did he have the fastest speed?
Concept: undefined >> undefined
The following graph shows the journey made by two cyclists, one from town A to B and the other from town B to A.
- At what time did cyclist II rest? How long did the cyclist rest?
- Was cyclist II cycling faster or slower after the rest?
- At what time did the two cyclists meet?
- How far had cyclist II travelled when he met cyclist I?
- When cyclist II reached town A, how far was cyclist I from town B?

Concept: undefined >> undefined
Ajita starts off from home at 07.00 hours with her father on a scooter that goes at a uniform speed of 30 km/h and drops her at her school after half an hour. She stays in the school till 13.30 hours and takes an auto-rickshaw to return home. The rickshaw has a uniform speed of 10 km/h. Draw the graph for the above situation and also determine the distance of Ajita’s school from her house.
Concept: undefined >> undefined
Draw the line graph using suitable scale to show the annual gross profit of a company for a period of five years.
| Year | 1st | 2nd | 3rd | 4th | 5th |
| Gross Profit (in Rs) |
17,00,000 | 15,50,000 | 11,40,000 | 12,10,000 | 14,90,000 |
Concept: undefined >> undefined
The table shows the data collected for Dhruv’s walking on a road.
| Time (in minutes) |
0 | 5 | 10 | 15 | 20 | 25 |
| Distance (in km) |
0 | 0.5 | 1 | 1.25 | 1.5 | 1.75 |
- Plot a line graph for the given data using a suitable scale.
- In what time periods did Dhruv make the most progress?
Concept: undefined >> undefined
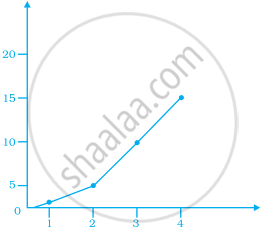
Observe the given graph carefully and complete the table given below.
| x | 1 | 2 | 3 | 4 | 5 |
| y |
Concept: undefined >> undefined
This graph shows the per cent of students who dropped out of school after completing High School. The point labelled A shows that, in 1996, about 4.7% of students dropped out.

- In which year was the dropout the rate highest? In which year was it the lowest?
- When did the per cent of students who dropped out of high school first fall below 5%?
- About what per cent of students dropped out of high school in 2007? About what per cent of students stayed in high school in 2008?
Concept: undefined >> undefined
Observe the toothpick pattern given below:
(a) Imagine that this pattern continues. Complete the table to show the number of toothpicks in the first six terms.
| Pattern | 1 | 2 | 3 | 4 | 5 | 6 |
| Toothpicks | 4 | 13 |
(b) Make a graph by taking the pattern numbers on the horizontal axis and the number of toothpicks on the vertical axis. Make the horizontal axis from 0 to 10 and the vertical axis from 0 to 30.
(c) Use your graph to predict the number of toothpicks in patterns 7 and 8. Check your answers by actually drawing them.
(d) Would it make sense to join the points on this graph? Explain.
Concept: undefined >> undefined
