Advertisements
Advertisements
Question
Which of the following diagrams (Figure) depicts ideal gas behaviour?
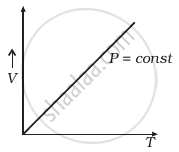 (a) |
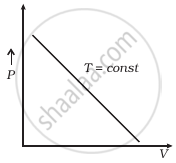 (b) |
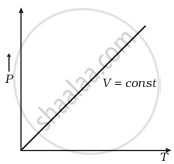 (c) |
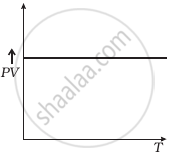 (d) |
Advertisements
Solution
a and c
Explanation:
For ideal gas behaviour,
PV = nRT ......(i)
(a) When pressure, P = constant
From (i) Volume V ∝ Temperature T
The graph of V versus T will be a straight line.
(b) When T = constant
From (i) PV = constant
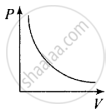
So, the graph of P versus V will be a rectangular hyperbola. Hence this graph is wrong. The correct graph is shown below:
(c) When V = constant
From (i) P ∝ T
So, the graph is a straight line passing through the origin.
(d) From (i) PV ∝ T
⇒ `(PV)/T` = constant
So, the graph of PV versus T will be a straight line parallel to the temperature axis (x-axis).
i.e., the slope of this graph will be zero.
So, (d) is not correct.
APPEARS IN
RELATED QUESTIONS
The figure shows the plot of PV/T versus Pfor 1.00×10⁻³ kg of oxygen gas at two different temperatures.
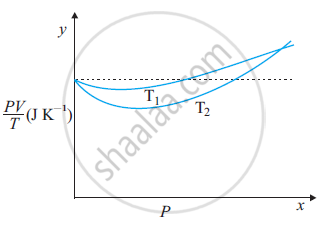
(a) What does the dotted plot signify?
(b) Which is true: T1 > T2 or T1 < T2?
(c) What is the value of PV/T where the curves meet on the y-axis?
(d) If we obtained similar plots for 1.00 ×10⁻³ kg of hydrogen, would we get the same value of PV/T at the point where the curves meet on the y-axis? If not, what mass of hydrogen yields the same value of PV/T (for low pressure high temperature region of the plot)? (Molecular mass of H2 = 2.02 u, of O2 = 32.0 u, R = 8.31 J mo1–1 K–1.)
Three vessels of equal capacity have gases at the same temperature and pressure. The first vessel contains neon (monatomic), the second contains chlorine (diatomic), and the third contains uranium hexafluoride (polyatomic).
Is the root mean square speed of molecules the same in the three cases? If not, in which case is vrms the largest?
At what temperature is the root mean square speed of an atom in an argon gas cylinder equal to the rms speed of a helium gas atom at – 20 °C? (atomic mass of Ar = 39.9 u, of He = 4.0 u).
Oxygen is filled in a closed metal jar of volume 1.0 × 10⁻³ m3 at a pressure of 1.5 × 10⁵Pa and temperature 400 K. The jar has a small leak in it. The atmospheric pressure is 1.0 × 10⁵ Pa and the atmospheric temperature is 300 K. Find the mass of the gas that leaks out by the time the pressure and the temperature inside the jar equalise with the surrounding.
50 m3 of saturated vapour is cooled down from 30°C to 20°C. Find the mass of the water condensed. The absolute humidity of saturated water vapour is 30 g m−3 at 30°C and 16 g m−3 at 20°C.
During the practical session in the lab when hydrogen sulphide gas having offensive odour is prepared for some test, we can smell the gas even 50 metres away. Explain the phenomenon.
Fill in the blanks:
If the temperature is reduced to half, ………….. would also reduce to half.
Name or state the following:
The standard pressure of a gas in cm. of mercury corresponding to one atmospheric pressure.
Give reason for the following:
Temperature remaining constant the product of the vol. & the press, of a given mass of dry gas is a constant.
If the absolute temperature of a body is doubled, the power radiated will increase by a factor of ______
The equation of state for 2g of oxygen at a pressure 'P' and temperature 'T', when occupying a volume 'V' will be ______.
Estimate the average thermal energy of a helium atom at the temperature on the surface of the Sun (6000 K).
Calculate the number of atoms in 39.4 g gold. Molar mass of gold is 197g mole–1.
A box of 1.00 m3 is filled with nitrogen at 1.50 atm at 300K. The box has a hole of an area 0.010 mm2. How much time is required for the pressure to reduce by 0.10 atm, if the pressure outside is 1 atm.
Cooking gas containers are kept in a lorry moving with uniform speed. The temperature of the gas molecules inside will ______.
At room temperature, a diatomic gas is found to have an r.m.s. speed of 1930 ms-1. The gas is ______.
For a wave, y = 0.0002 sin`[2pi(110"t"-x/3)+pi/3]` is travelling in a medium. The energy per unit volume being transferred by wave if density of medium is 1.5 kg/m3, is ______.
P ∝ T at constant volume is the statement of ______.
