Advertisements
Advertisements
Question
A car accelerates to a velocity of 30 m/s in 10 s and then decelerates for 20 s so that it stops. Draw a velocity-time graph to represent the motion and find:
Distance travelled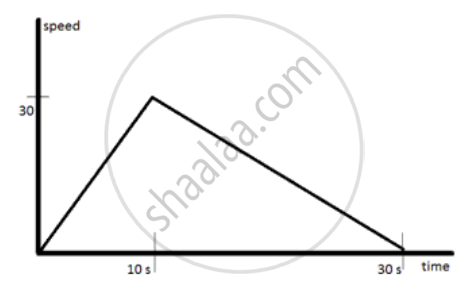
Advertisements
Solution

Distance travelled= area under speed time graph = `1/2`x30x30 =450 m.
APPEARS IN
RELATED QUESTIONS
State the type of motion represented by the following sketches in Figures.
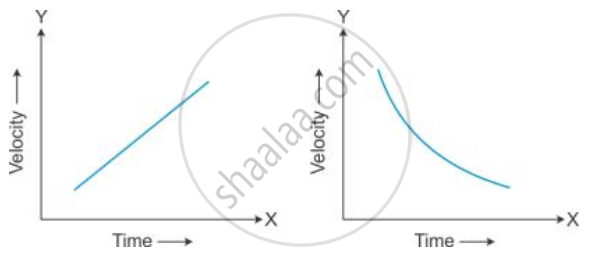
Give an example of each type of motion.
A train starts from rest and accelerates uniformly at a rate of 2 m s−2 for 10 s. It then maintains a constant speed for 200 s. The brakes are then applied and the train is uniformly retarded and comes to rest in 50 s. Find
- The maximum velocity reached,
- The retardation in the last 50 s,
- The total distance travelled,
- The average velocity of the train.
A motorbike, initially at rest, picks up a velocity of 72 kmh−1 over a distance of 40 m. Calculate
- acceleration
- time in which it picks up above velocity.
The acceleration of a moving body is constant in magnitude and direction. Must the path of the body be a straight line?
If not, given an example.
Write the SI unit of acceleration and retardation.
What happens to the stepwise increasing speed-time graph when the size of each step is made very small?
Convert the following acceleration:
7200 km/h2 into m/s2
What do you mean by constant acceleration?
When a body starts from rest, the acceleration of the body after 2 seconds in ______ of its displacement.
An object can be moving with uniform speed but with variable acceleration.
