Advertisements
Advertisements
प्रश्न
A car accelerates to a velocity of 30 m/s in 10 s and then decelerates for 20 s so that it stops. Draw a velocity-time graph to represent the motion and find:
Distance travelled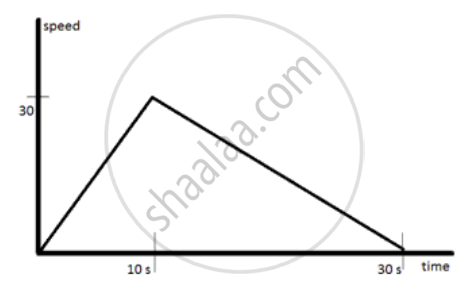
Advertisements
उत्तर

Distance travelled= area under speed time graph = `1/2`x30x30 =450 m.
APPEARS IN
संबंधित प्रश्न
A ball is rolling from A to D on a flat and smooth surface. Its speed is 2 cm/s. On reaching B, it was pushed continuously up to C. On reaching D from C, its speed had become 4 cm/s. It took 2 seconds for it to go from B to C. What is the acceleration of the ball as it goes from B to C?

State its value in C.G.S. as well as in S.I. system.
Draw velocity – time graph for the following situation:
When a body is moving with variable velocity, but uniform retardation.
From the diagram given below, calculate acceleration.
Diagram is given below shows velocity – time graph of car P and Q, starting from the same place and in the same direction. Calculate the Acceleration of car P.

An aeroplane lands at 216 kmh−1 and stops after covering a runway of 2 m. Calculate the acceleration and the time, in which it comes to rest.
What do you mean by constant acceleration?
State whether true or false. If false, correct the statement.
Acceleration can get negative value also.
What is meant by negative acceleration?
A bus accelerating with 4ms-2 changes its speed from 60ms_1 to a certain value in 5s. The final speed is ______.
