Advertisements
Advertisements
प्रश्न
A car accelerates to a velocity of 30 m/s in 10 s and then decelerates for 20 s so that it stops. Draw a velocity-time graph to represent the motion and find:
Distance travelled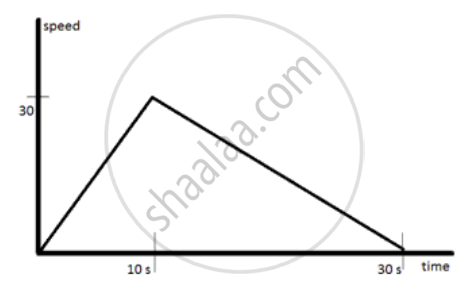
Advertisements
उत्तर

Distance travelled= area under speed time graph = `1/2`x30x30 =450 m.
APPEARS IN
संबंधित प्रश्न
State the type of motion represented by the following sketches in Figures.
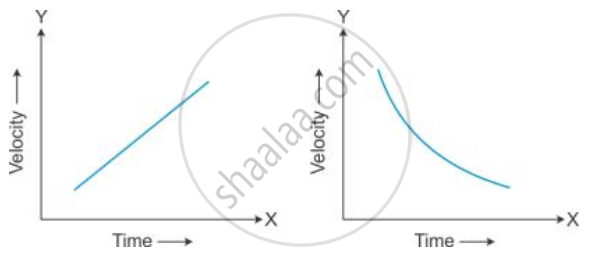
Give an example of each type of motion.
A bullet initially moving with a velocity 20 m/s strikes a target and comes to rest after penetrating a distance 10 cm into the target. Calculate the retardation caused by the target.
The change in velocity of a motorbike is 54 kmh−1 in one minute. Calculate its acceleration in (a) ms−2 (b) kmh−2.
The initial velocity of a car is 10 ms-1. It moves with an acceleration of 2 ms-2. What will be its speed after 10 seconds?
State if the following situation is possible:
A body moving with a constant velocity in an accelerated motion.
Interpret the following graph: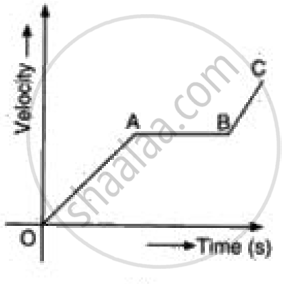
What happens to the stepwise increasing speed-time graph when the size of each step is made very small?
A car accelerates uniformly from a velocity of 18 km/h to 36 km/h in 15 min. What is its acceleration?
The Unit of acceleration is ______.
Assertion: When a body is subjected to a uniform acceleration, it is always moving in a straight line.
Reason: Motion may be straight-line motion or circular motion.
