Advertisements
Advertisements
प्रश्न
A car travels with uniform velocity of 25 m s-1 for 5 s. The brakes are then applied and the car is uniformly retarded and comes to rest in further 10 s. Find:
- The distance which the car travels before the brakes are applied,
- Retardation and
- The distance travelled by car after applying the brakes.
Advertisements
उत्तर
(i) As we know, Distance = Speed × time
Initial velocity (u) = 25 m s-1; Final velocity (v) = 0; time = 5 s
Substituting the values in the formula,
Distance = Speed × time
Distance = (25) × (5) m
∴ Distance = 125 m
(ii) Acceleration = `("Final velocity" - "Initial velocity")/"Time taken"`
∴ a = `("v" - "u")/"t"`
= `(0 - 25)/10` ms-2
= `(-5)/2` ms-2
= - 2.5 ms-2
∵ If v < u, then a is negative, and a is the retardation.
Therefore, retardation = 2.5 ms-2
(iii) After applying brakes, the time taken to come to stop = 10 s
Let S' be the distance travelled after applying the brakes.
Initial velocity u = 25 m/s
Final velocity v = 0
Using the third equation of motion,
∴ v2 - u2 = 2as
We get,
⇒ (0) 2 - (25)2 = 2 (- 2.5) (S')
⇒ 625 = 5(S')
⇒ `625/5` = S'
⇒ S' = 125 m
APPEARS IN
संबंधित प्रश्न
What is meant by the term retardation? Name its S.I. unit.
A train moving with a velocity of 20 ms−1 is brought to rest by applying brakes in 5 s. Calculate the retardation.
A ball is rolling from A to D on a flat and smooth surface. Its speed is 2 cm/s. On reaching B, it was pushed continuously up to C. On reaching D from C, its speed had become 4 cm/s. It took 2 seconds for it to go from B to C. What is the acceleration of the ball as it goes from B to C?

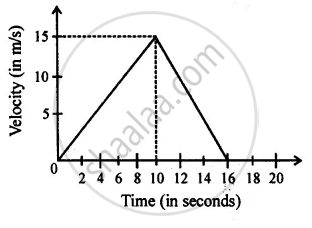
From the diagram given below, calculate acceleration.
A motor bike running at 5 ms−1, picks up a velocity of 30 ms−1 in 5s. Calculate
- acceleration
- distance covered during acceleration.
Convert the following acceleration:
7200 km/h2 into m/s2
From the given v-t graph it can be inferred that an object is

When a body starts from rest, the acceleration of the body after 2 seconds in ______ of its displacement.
It is possible to have objects moving with uniform speed but variable acceleration.
Assertion: A negative acceleration of a body can be associated with speeding up of the body.
Reason: Increase in the speed of a moving body is independent of its direction of motion.
