Advertisements
Advertisements
प्रश्न
A space craft flying in a straight course with velocity of 75 km s-1 fires its rocket motors for 6.0 s. At the end of this time its speed is 120 km s-1 in the same direction.
Find
(i) The space craft's average acceleration while the motors were firing
(ii) The distance travelled by the space craft in the first 10 s after the rocket motors were started, the motors being in action for only 6 s.
Advertisements
उत्तर
Given, the initial velocity u = 75 km/s
Final velocity v = 120 km/s
Time taken = 6 s
(i) Acceleration = (Final velocity - Initial velocity)/time taken
= [(120 - 75)/6] kms-2
= (45/6) kms-2
= 7.5 kms-2
(ii) Distance travelled by the aircraft in the first 10 s = Distance travelled in the first 6 s + Distance travelled in the next 4 s.
Distance travelled in the first 6s (S1) = ut + (1/2) at2
(S1) = ut + (1/2) at2
(S1) = (75)(6) + (1/2) (7.5)(6)2
(S1) = 450 + 135
(S1) = 585 km
Distance travelled in the next 4 s (S2) = Speed × time
Speed at the end of 6 s is 120 km/s.
(S2) = (120) (4)
(S2) = 480 km
Thus, the distance travelled by the aircraft in the first 10 s = (S1) + (S2) = 585 + 480 = 1065 km.
APPEARS IN
संबंधित प्रश्न
Figure given below shows a velocity-time graph for a car starting from rest. The graph has three parts AB, BC and CD.
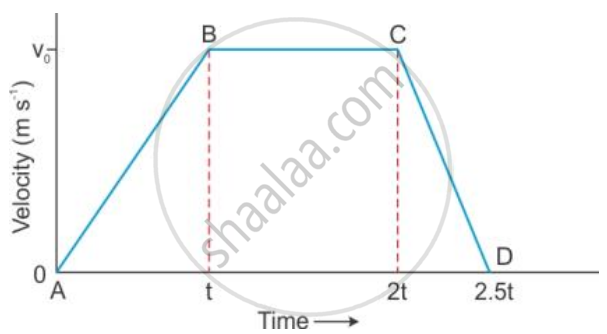
(a) Is the magnitude of acceleration higher or lower than that of retardation ? Give a reason .
(b) Compare the magnitude of acceleration and retardation .
A train starts from rest and accelerates uniformly at a rate of 2 m s−2 for 10 s. It then maintains a constant speed for 200 s. The brakes are then applied and the train is uniformly retarded and comes to rest in 50 s. Find
- The maximum velocity reached,
- The retardation in the last 50 s,
- The total distance travelled,
- The average velocity of the train.
Diagram is given below shows velocity – time graph of car P and Q, starting from the same place and in the same direction. Calculate the Acceleration of car P.

A racing car, initially at rest, picks up a velocity of 180 kmh−1 in 4.5 s. Calculate
- acceleration
- distance covered by the car.
A body falls towards the earth. Does it have positive or negative acceleration?
State if the following situation is possible:
A body moving horizontally with an acceleration in vertical direction.
State if the following situation is possible:
A body moving with a constant velocity in an accelerated motion.
A body has an acceleration of -3.5 ms-2. What is its retardation?
Convert the following acceleration:
1/36 m/s2 into km/h2
When a body is said to be in
- uniform acceleration
- non–uniform acceleration?
