Advertisements
Advertisements
प्रश्न
A train starts from rest and accelerates uniformly at a rate of 2 m s−2 for 10 s. It then maintains a constant speed for 200 s. The brakes are then applied and the train is uniformly retarded and comes to rest in 50 s. Find
- The maximum velocity reached,
- The retardation in the last 50 s,
- The total distance travelled,
- The average velocity of the train.
Advertisements
उत्तर
(i) For the first 10 s, initial velocity u = 0
Acceleration a = 2 m/s2
Time taken t = 10 s
Let v be the maximum velocity reached.
Using the first equation of motion
v = u + at
We get
V = (0) + (2) (10)
= 20 m/s−1
(ii) For the last 50 s:
Final velocity = 0 m/s,
Initial velocity = 20 m/s.
`"Acceleration" = ("Final velocity" - "Initial velocity")/"time"`
= `(0 - 20)/50`
= −0.4 m/s2
Retardation = 0.4 m/s−2
(iii) Total distance travelled = Distance travelled in the first 10 s + Distance travelled in 200 s + Distance travelled in last 50 s
Distance travelled in first 10 s (s1) = `ut + (1/2) at^2`
S1 = `(0) + (1/2) (2 xx 10^2)`
S1 = 100 m
Distance travelled in 200 s (s2) = speed × time
S2 = (20) (200) = 4000 m
Distance travelled in last 50 s (s3) = ut + (1/2) at2
Here, u = 20 m/s, t = 50 s and a = −0.4 m/s2
S3 = `(20 xx 50) + (1/2) (-0.4 xx 50^2)`
S3 = 1000 − 500
S3 = 500 m
Therefore, total distance travelled = S1 + S2 + S3
= 100 + 4000 + 500
= 4600 m
(iv) `"Average velocity" = "Total distance travelled"/"total time taken"`
= (4600/260) m/s
= 17.69 m/s−1
APPEARS IN
संबंधित प्रश्न
State the type of motion represented by the following sketches in Figures.
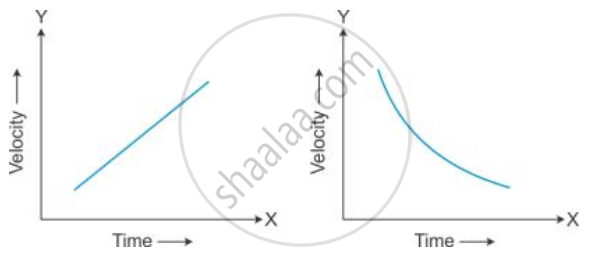
Give an example of each type of motion.
The change in velocity of a motorbike is 54 kmh−1 in one minute. Calculate its acceleration in (a) ms−2 (b) kmh−2.
What does a positive acceleration mean?
The acceleration of a body is 8.5 ms-2. What does this statement mean?
Write the SI unit of retardation.
State if the following situation is possible:
A body moving with constant acceleration but with Zero velocity.
The graph shows how the velocity of a scooter varies with time in 50 s.
Work out: Deceleration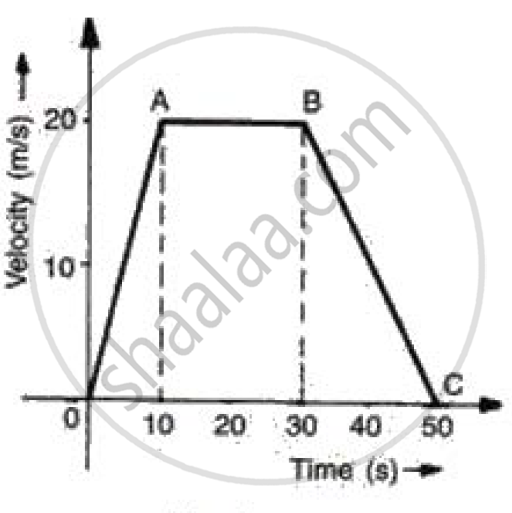
When an object undergoes acceleration ______.
A bus accelerating with 4ms-2 changes its speed from 60ms_1 to a certain value in 5s. The final speed is ______.
It is possible to have objects moving with uniform speed but variable acceleration.
