Advertisements
Advertisements
प्रश्न
What happens to the stepwise increasing speed-time graph when the size of each step is made very small?
Advertisements
उत्तर
The graph becomes straight line with positive slope with time axis and represents almost a constant acceleration.
APPEARS IN
संबंधित प्रश्न
Define the term acceleration due to gravity. State its average value.
State the type of motion represented by the following sketches in Figures.
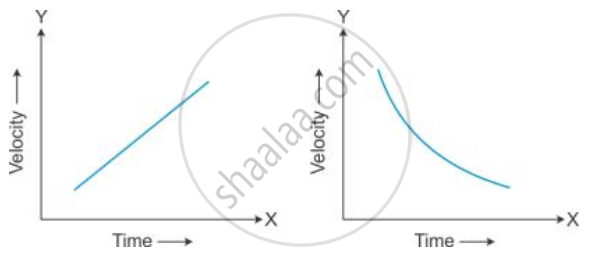
Give an example of each type of motion.
A train moving with a velocity of 20 ms−1 is brought to rest by applying brakes in 5 s. Calculate the retardation.
A vehicle is accelerating on a straight road. Its velocity at any instant is 30 km/h. After 2 s, it is 33.6 km/h, and after further 2 s, it is 37.2 km/h. Find the acceleration of the vehicle in m s-2. Is the acceleration uniform?
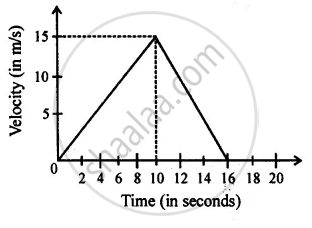
From the diagram given below, calculate acceleration.
Convert the following acceleration:
1/36 m/s2 into km/h2
A car starts from rest and it is travelling with a velocity of 20 m/s in 10 s. What is its acceleration?
A quantity has a value of 16ms-2. It is the ______.
If a moving body comes to rest, then its acceleration is ______.
A car is being driven at a speed of 20ms-1 when brakes are applied to bring it to rest in 5 s. The deceleration produced in this case will be ______.
