Advertisements
Advertisements
प्रश्न
What happens to the stepwise increasing speed-time graph when the size of each step is made very small?
Advertisements
उत्तर
The graph becomes straight line with positive slope with time axis and represents almost a constant acceleration.
APPEARS IN
संबंधित प्रश्न
A body is moving vertically upwards. Its velocity changes at a constant rate from 50 m s−1 to 20 m s−1 in 3 s. What is its acceleration?
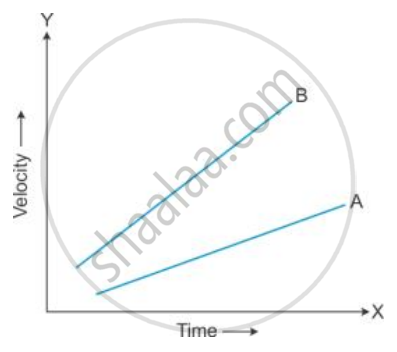
Figure shows the velocity-time graphs for two cars A and B moving in the same direction. Which car has greater acceleration? Give reasons to your answer.
State its value in C.G.S. as well as in S.I. system.
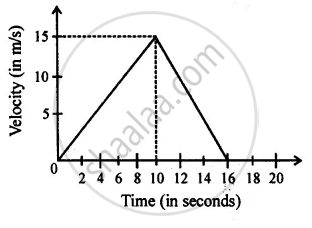
From the diagram given below, calculate deceleration.
Can you use the relation [B1]?
Out of energy and acceleration, which one is a vector?
State if the following situation is possible:
A body moving horizontally with an acceleration in vertical direction.
Negative acceleration is called ______.
The speed of a particle is constant. Will it have acceleration? Justify with an example.
A quantity has a value of 16ms-2. It is the ______.
