Advertisements
Advertisements
Question
State the type of motion represented by the following sketches in Figures.
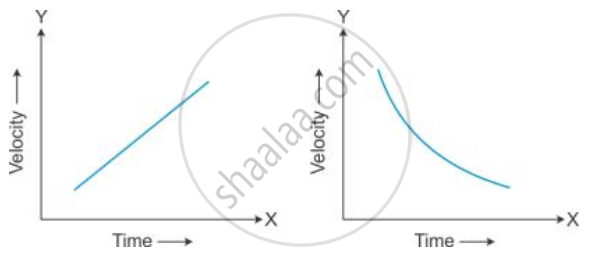
Give an example of each type of motion.
Advertisements
Solution
-
Type of Motion:Uniform Acceleration
-
The graph shows a straight line with a positive slope, indicating that velocity increases at a constant rate over time.
-
This means the object is accelerating uniformly.
Example:
A car increasing its speed steadily on a straight road (e.g., from 0 km/h to 60 km/h in 10 seconds at a constant rate). -
-
Type of Motion: Non-Uniform Retardation (Deceleration)
-
The graph shows a curved line with a decreasing slope, indicating that velocity is decreasing over time, but not at a constant rate.
-
This means the object is slowing down, and the rate of slowing down is changing.
Example:
A bicycle coming to a stop when brakes are applied gently and gradually. -
APPEARS IN
RELATED QUESTIONS
Draw velocity – time graph for the following situation:
When a body is moving with variable velocity and variable acceleration.
A motorbike, initially at rest, picks up a velocity of 72 kmh−1 over a distance of 40 m. Calculate
- acceleration
- time in which it picks up above velocity.
State if the following situation is possible:
A body moving with a constant velocity in an accelerated motion.
Interpret the following graph:
The graph shows how the velocity of a scooter varies with time in 50 s.
Work out: Acceleration.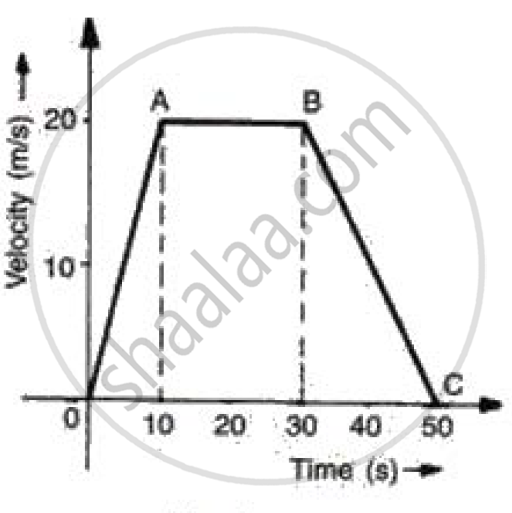
Correct your friend who says that acceleration gives the idea of how fast the position changes.
The speed of a particle is constant. Will it have acceleration? Justify with an example.
A quantity has a value of 16ms-2. It is the ______.
An object can be moving with uniform speed but with variable acceleration.
Assertion: A positive acceleration of a body can be associated with the slowing down of the body.
Reason: Acceleration is a vector.
