Advertisements
Chapters
1: World Geography: Some Glimpses
Theme B - Tapestry of the Past
2: India’s Long Road to Independence
Theme C - Our Cultural Heritage and Knowledge Traditions
3: A Journey Through Indian Architecture
Theme D - Governance and Democracy
4: The Role of the Judiciary in Our Society
5: Citizenship: Rights and Duties
Theme E - Economic Life Around Us
▶ 6: Dynamics of Population
7: India’s Urban Landscape
8: Cultural Currents: 13th to 17th Centuries
![NCERT solutions for Social Science Exploring Society India and Beyond Part 2 [English] Class 8 chapter 6 - Dynamics of Population - Shaalaa.com](/images/social-science-exploring-society-india-and-beyond-part-2-english-class-8_6:d01fdcd1fdf244fc869f361ef89f5af3.png "NCERT solutions for Social Science Exploring Society India and Beyond Part 2 [English] Class 8 chapter 6 - Dynamics of Population")
Advertisements
Solutions for Chapter 6: Dynamics of Population
Below listed, you can find solutions for Chapter 6 of CBSE NCERT for Social Science Exploring Society India and Beyond Part 2 [English] Class 8.
NCERT solutions for Social Science Exploring Society India and Beyond Part 2 [English] Class 8 6 Dynamics of Population Intext Questions [Pages 167 - 183]
The Big Questions
What is demography?
What are some important concepts of demography?
How has the population of India changed over time?
How has the population of the world changed over time?
How do population trends shape societies and economies?
LET’S EXPLORE
Ask your family members if they have observed any of the following changes around them over the years:
- farmland or green spaces being turned into new buildings for housing
- more crowded streets; more cars and buses; and traffic congestion in public spaces
- changing types of homes (e.g., smaller apartments, more single-family homes)
What could be the possible reasons behind these changes?
Why is the replacement rate 2.1 and not 2 (parents get replaced by children)? What are the situations in which the replacement rate can be higher?
Observe fertility and literacy rates in select Indian states in Fig. Do you find a relationship between the two indicators? Prepare a report on your observations and possible reasons for the same.
| State/UT | Fertility rate | Literacy rate among women (%) |
| Bihar | 3.0 | 55 |
| Uttar Pradesh | 2.4 | 66.1 |
| Jharkhand | 2.3 | 61.7 |
| Karnataka | 1.7 | 73.4 |
| Punjab | 1.6 | 79.4 |
| Delhi | 1.6 | 83.7 |
THINK ABOUT IT
If many young people migrate from villages or smaller towns to cities, what changes could take place in their native villages?
LET’S EXPLORE
Census figures of 2001 as well as 2011 show the overall number of females per 1,000 males being much less than 1,000. Some states, however, had over 1,000 or near 1,000 (Kerala, Puducherry, Tamil Nadu). What might be the reasons for this?
DON’T MISS OUT
While the term ‘population pyramid’ is used widely, the representation on paper looks more like a triangle, parts of which have been pulled outwards or shrunk, into different shapes a 3-dimensional concept represented in 2 dimensions.
THINK ABOUT IT
If the replacement rate is less than 2, what will the population pyramid look like? Will there ever be a situation where the number of children is less than the number of aged people? What is likely to happen to the population of such a country over time?
NCERT solutions for Social Science Exploring Society India and Beyond Part 2 [English] Class 8 6 Dynamics of Population Questions and activities [Pages 187 - 190]
Why is it important for a country to study its population through demography?
How can a low fertility rate affect a country’s future economy and workforce?
Do you think a high birth rate is always good for a country? Why or why not?
Do you think it’s better to have more people or fewer people in a country?
What are the challenges countries face in the case of a fast-growing or shrinking population?
How does the age structure of a country affect the kind of jobs and services it needs? Explain with examples.
Why do you think families are generally getting smaller? Does having fewer children ensure better education and health for them? How does it affect families and society?
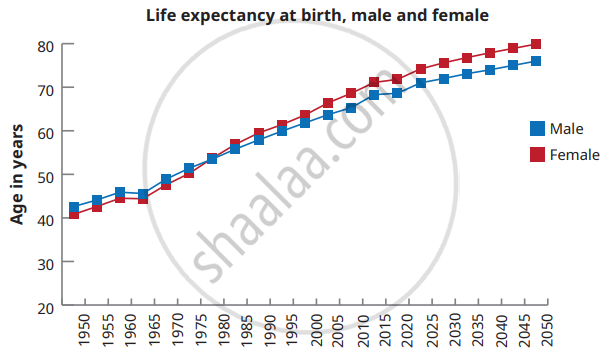
Observe the graph below showing changes in life expectancy across gender in India and answer the questions given below:
- Has the life expectancy in India increased? If yes, what could be the reasons?
- What was the life expectancy of males and females in 2010?
What is a demographic dividend?
How does a demographic dividend benefit a country?
What do you think India needs to do today to make the most of its demographic dividend before 2050?
Countries (for example: India and Japan). Find out their:
- Population size
- Fertility rate
- Life expectancy
- Age distribution
How are they different? What might be the reasons behind these differences? For instance, find out how countries with ageing populations are managing this.
Countries (for example: Nigeria and Italy). Find out their:
- Population size
- Fertility rate
- Life expectancy
- Age distribution
How are they different? What might be the reasons behind these differences? For instance, find out how countries with ageing populations are managing this.
Imagine you are a researcher who intends to study migration patterns in your locality. Make a questionnaire to collect data on the following questions.
- Name of the person
- Age of the person
- Occupation of the person
- Place of residence
- Number of years lived in the place
- List the factors contributing to migration, such as lack of facilities, poor infrastructure, limited job opportunities and so on
Draw a population pyramid on graph paper for India using the data given in the following table.
| Age-group-wise percentage distribution of population (estimated for 2021) |
||
| Age Group | Male | Female |
| 0–4 | 8.6 | 8.2 |
| 5–9 | 8.9 | 8.4 |
| 10–14 | 8.7 | 8.6 |
| 15–19 | 9.3 | 9.0 |
| 20–24 | 9.5 | 9.1 |
| 25–29 | 9.0 | 8.6 |
| 30–34 | 8.1 | 8.0 |
| 35–39 | 7.1 | 7.4 |
| 40–44 | 6.3 | 6.7 |
| 45–49 | 5.7 | 6.0 |
| 50–54 | 5.0 | 5.2 |
| 55–59 | 4.2 | 4.2 |
| 60–64 | 3.2 | 3.3 |
| 65–69 | 2.4 | 2.7 |
| 70–74 | 1.8 | 2.1 |
| 75–79 | 1.2 | 1.4 |
| 80+ | 0.9 | 1.2 |
Observe the population pyramid for Japan in 2023 below. What can you infer from this? Write your observations and share in the class.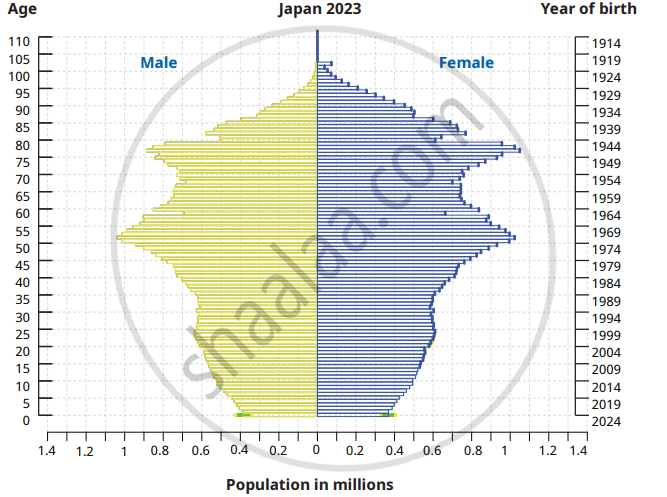
Solutions for 6: Dynamics of Population
NCERT solutions for Social Science Exploring Society India and Beyond Part 2 [English] Class 8 chapter 6 - Dynamics of Population
Shaalaa.com has the CBSE Mathematics Social Science Exploring Society India and Beyond Part 2 [English] Class 8 CBSE solutions in a manner that help students grasp basic concepts better and faster. The detailed, step-by-step solutions will help you understand the concepts better and clarify any confusion. NCERT solutions for Mathematics Social Science Exploring Society India and Beyond Part 2 [English] Class 8 CBSE 6 (Dynamics of Population) include all questions with answers and detailed explanations. This will clear students' doubts about questions and improve their application skills while preparing for board exams.
Further, we at Shaalaa.com provide such solutions so students can prepare for written exams. NCERT textbook solutions can be a core help for self-study and provide excellent self-help guidance for students.
Concepts covered in Social Science Exploring Society India and Beyond Part 2 [English] Class 8 chapter 6 Dynamics of Population are .
Using NCERT Social Science Exploring Society India and Beyond Part 2 [English] Class 8 solutions Dynamics of Population exercise by students is an easy way to prepare for the exams, as they involve solutions arranged chapter-wise and also page-wise. The questions involved in NCERT Solutions are essential questions that can be asked in the final exam. Maximum CBSE Social Science Exploring Society India and Beyond Part 2 [English] Class 8 students prefer NCERT Textbook Solutions to score more in exams.
Get the free view of Chapter 6, Dynamics of Population Social Science Exploring Society India and Beyond Part 2 [English] Class 8 additional questions for Mathematics Social Science Exploring Society India and Beyond Part 2 [English] Class 8 CBSE, and you can use Shaalaa.com to keep it handy for your exam preparation.
