Advertisements
Online Mock Tests
Chapters
![Balbharati solutions for Geography [English] Standard 10 Maharashtra State Board chapter 8 - Economy and Occupations - Shaalaa.com](/images/geography-english-standard-10-maharashtra-state-board_6:64aff6684df04e9e943283f0e8e55f89.jpg "Balbharati solutions for Geography [English] Standard 10 Maharashtra State Board chapter 8 - Economy and Occupations")
Advertisements
Solutions for Chapter 8: Economy and Occupations
Below listed, you can find solutions for Chapter 8 of Maharashtra State Board Balbharati for Geography [English] Standard 10 Maharashtra State Board.
Balbharati solutions for Geography [English] Standard 10 Maharashtra State Board 8 Economy and Occupations Intext Questions [Pages 52 - 59]
Give it a try.
Read the following graph and answer the questions:
Gross National Incomes (GNI) from 1960 to 2016 (in million US $)
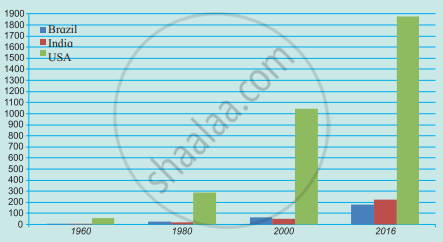
- Which country’s national income was highest in 2016 and was it how much?
- Comparing India and Brazil, which country had a higher national income in 1980?
- Comparing India and Brazil, which country had a higher income in 2016?
- Tell the difference between the GNP of Brazil and India in 2016.
- Calculate the difference between the national incomes of developed and developing countries in 2016.
Try this.
A table regarding the ownership of various sectors in both the countries is given. Like Brazil, fill the details regarding India and complete the table.
| Sr. No. | India | Sector | Brazil |
| 1. | -- | Banking | Private and public both |
| 2. | -- | Railways | Private and public both |
| 3. | -- | Airways | Private and public both |
| 4. | -- | Electricity production | Largely public |
| 5. | -- | Iron and Steel Industry | Largely public |
| 6. | -- | Health | Private and public both |
| 7. | -- | Education | Largely public, little private |
| 8. | -- | Telecommunications | Private and public both |
On the basis of the information about the ownership of various sectors in both the countries given in the table, can you infer about the type of these economies?
Let’s recall.
Classify the following activities in by ticking (✓) in the respective column.
| Activities | Primary | Secondary | Tertiary |
| Television Broadcasting | |||
| Bee-keeping | |||
| Coir and Rope making | |||
| Jaggery-making | |||
| Producing blades of the plough. |
|||
| Construction | |||
| Extracting Iron Ore | |||
| Automobile Production | |||
| Rice Production | |||
| Teaching | |||
| Driving buses | |||
| Providing lodging and boarding facilities |
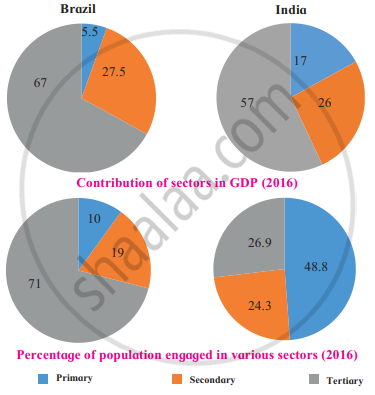
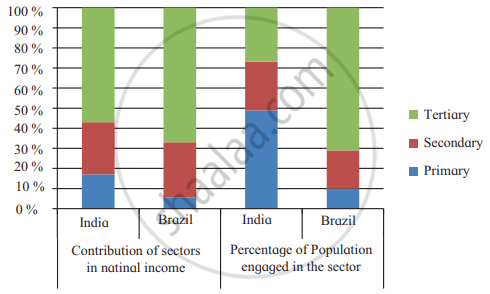
In figure given below, the pie-charts show the contribution of each sector in the respective country’s GDP and the percentage of population engaged in various activities. Read both the pie-charts carefully and answer the following questions.

- Which country has a higher percentage of population engaged in primary activities?
- In which country is the contribution of tertiary sector greater in the GDP?
- In which country is the share of secondary activities more in the GDP?
- Can we say that Brazil is an agrarian economy like India? Give reasons.
Think about it.
Which type of occupations gives a boost to the development of a country’s economy?
Make friends with maps!
Look at the map given below. The major primary occupations in Brazil are shown here. Discuss the following points and write your observations.

- In which part of Brazil is coffee mainly produced?
- Which food crops are mainly grown in Brazil?
- Can you relate the production of these crops with the climate there?
- Where are the rubber plantations concentrated?
- Complete the table.
Type of crops Crops Areas of production Food crops Cash Crops Fruits and Vegetables
Observe the figure and answer the following questions.
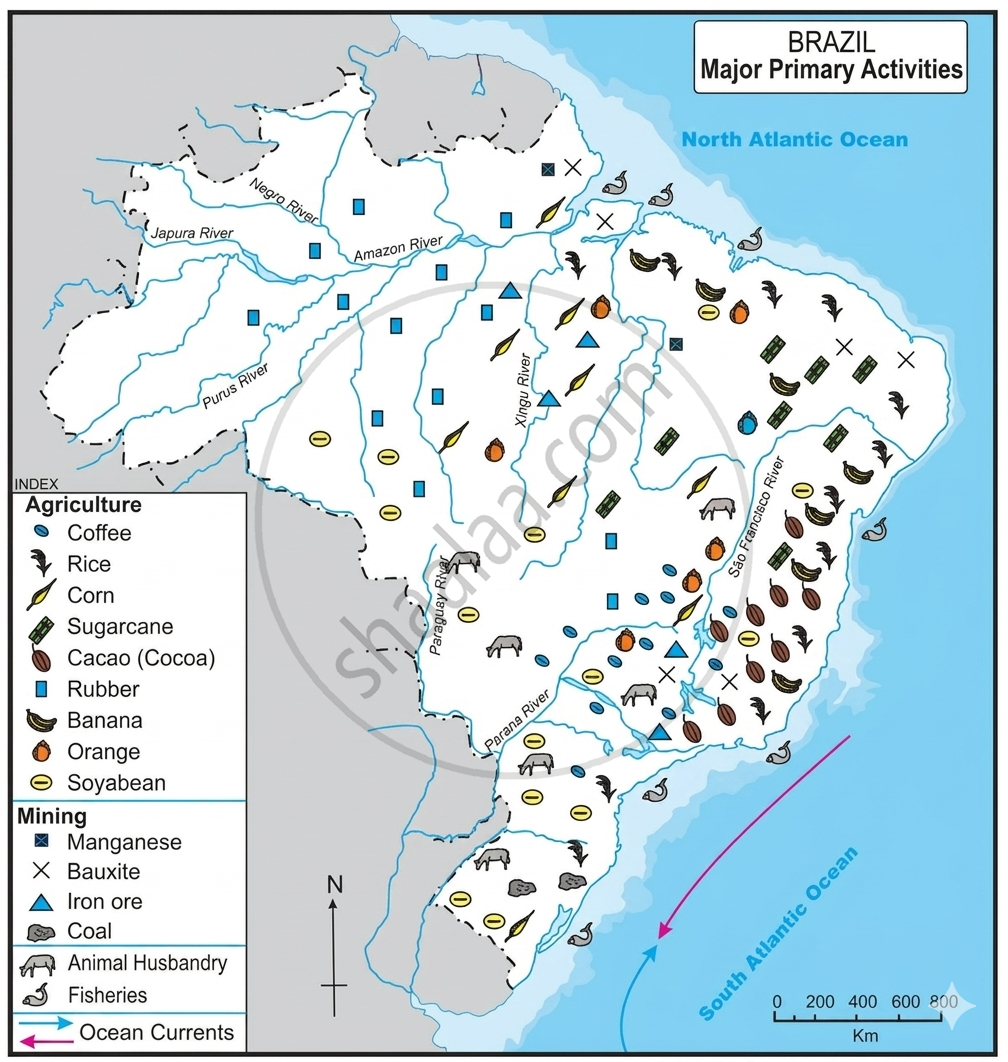
- Prepare a table of mining products and regions of production in Brazil.
- In which part of Brazil has mining activity not developed? What could be the reasons?
- Considering the availability of resources, were has the development of industries occurred?
- Can you give two reasons of concentration of fishing near the south-eastern coast of Brazil?
- Inland fishing is not developed in Brazil though there is large number of rivers in Brazil. Can you think of a reason?
Let’s recall.
Name the warm and cold ocean currents near Brazilian coasts.
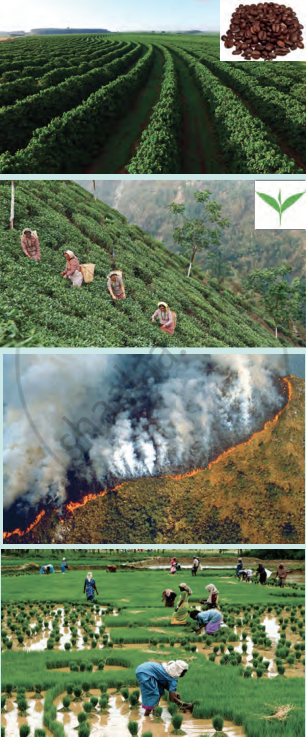
Give it a try.
The following images are related to agricultural activities. Identify and write whether they are practised in Brazil or India.
Try this.
Show the distribution of crops like wheat, jowar, rice, cotton, sugarcane, tea and apple in the outline map of India. using symbols Name the map.
Find out.
Obtain information regarding pisciculture in India with the help of internet and reference books and write a note.
Let’s recall.
With the help of the pie chart given in the fig., tell what the contribution of secondary activities is to Brazil’s GDP?
Look at fig. Observe the logos given below and answer the following questions.
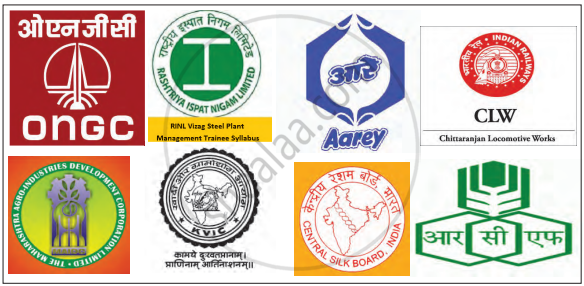
- Identify the industries with which they are associated.
- Which raw material is used for these industries. Classify them accordingly.
- From which part of India do they get these raw materials? Discuss and write.
Let’s recall.
Read the adjoining table and answer the following questions.
| Export, Import and Balance of Trade (Value in US $) | ||||
| India | Brazil | |||
| Year | Exports | Imports | Exports | Imports |
| 2009 - 10 | 178751.4 | 288372.9 | 152994.7 | 127647.3 |
| 2010 - 11 | 251136 | 369770 | 197356.4 | 180458.8 |
| 2011 - 12 | 304623.53 | 489181.3 | 256038.7 | 226243.4 |
| 2012 - 13 | 214099.8 | 361271.9 | 242579.8 | 223149.1 |
- What is balance of trade?
- Tell the types of balance of trades.
- In which country export exceeds import in all the years?
- Brazil’s balance of trade belong to which type?
- India’s balance of trade belong to which type?
Use your brain power!
If Rajasthan does not have a coastal area, then how does it produce salt?
Colours of Both
Answer the following.

- What does BRICS stand for?
- When was it established?
- What are the objectives of this bloc?
- The countries of which continent are not a member of this bloc?
- In which continents do the member countries lie?
Given fig. shows the trade between India and Brazil. Study the graphs and answer the following questions.
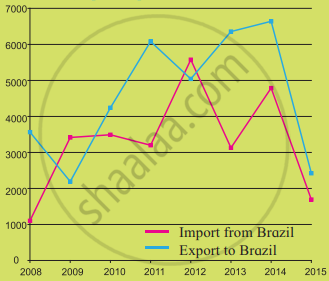
- In which year the value of exports to Brazil exceeded the imports from Brazil?
- In which year the trade with Brazil was most favourable of all?
- Comment upon the Balance of Trade in the year 2013.
- From which year the value of exports to Brazil have exceeded the value of imports from Brazil?
- Write a note on the trade between Brazil and India.
Balbharati solutions for Geography [English] Standard 10 Maharashtra State Board 8 Economy and Occupations Exercise [Pages 59 - 60]
Fill in the blank with appropriate word.
India’s per capita income is less than Brazil due to ______.
Low national income
Massive Population
Big family size
Low foodgrain production
The economy of Brazil is mainly dependent on the ______ activities there.
Primary
Secondary
Tertiary
Quaternary
The economies of India and Brazil are of the ______ type.
Undeveloped
Developed
Developing
Highly developed
Answer the following questions:
Why has mining not developed in the western part of Brazil?
What are the similarities in the fishing activities in Brazil and India?
What are the differences in the fishing activities in Brazil and India?
Give geographical reasons.
Per capita land availability is more in Brazil as compared to India.
Give reasons.
There is mixed economy in Brazil and India.
Study the following graph and analyse in short.
Solutions for 8: Economy and Occupations
Balbharati solutions for Geography [English] Standard 10 Maharashtra State Board chapter 8 - Economy and Occupations
Shaalaa.com has the Maharashtra State Board Mathematics Geography [English] Standard 10 Maharashtra State Board Maharashtra State Board solutions in a manner that help students grasp basic concepts better and faster. The detailed, step-by-step solutions will help you understand the concepts better and clarify any confusion. Balbharati solutions for Mathematics Geography [English] Standard 10 Maharashtra State Board Maharashtra State Board 8 (Economy and Occupations) include all questions with answers and detailed explanations. This will clear students' doubts about questions and improve their application skills while preparing for board exams.
Further, we at Shaalaa.com provide such solutions so students can prepare for written exams. Balbharati textbook solutions can be a core help for self-study and provide excellent self-help guidance for students.
Concepts covered in Geography [English] Standard 10 Maharashtra State Board chapter 8 Economy and Occupations are Economic Activities in Brazil and India, Economic Structure of India and Brazil, Economic Activities in Brazil, Economic Activities in India, Industries in Brazil, Industries in India, Trade in Brazil and India.
Using Balbharati Geography [English] Standard 10 Maharashtra State Board solutions Economy and Occupations exercise by students is an easy way to prepare for the exams, as they involve solutions arranged chapter-wise and also page-wise. The questions involved in Balbharati Solutions are essential questions that can be asked in the final exam. Maximum Maharashtra State Board Geography [English] Standard 10 Maharashtra State Board students prefer Balbharati Textbook Solutions to score more in exams.
Get the free view of Chapter 8, Economy and Occupations Geography [English] Standard 10 Maharashtra State Board additional questions for Mathematics Geography [English] Standard 10 Maharashtra State Board Maharashtra State Board, and you can use Shaalaa.com to keep it handy for your exam preparation.
