Advertisements
Advertisements
Question
Read the following graph and answer the questions:
Gross National Incomes (GNI) from 1960 to 2016 (in million US $)
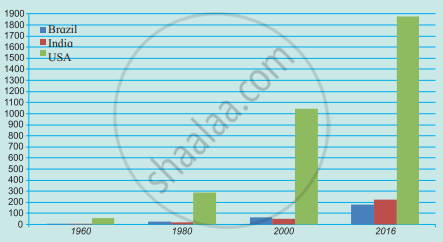
- Which country’s national income was highest in 2016 and was it how much?
- Comparing India and Brazil, which country had a higher national income in 1980?
- Comparing India and Brazil, which country had a higher income in 2016?
- Tell the difference between the GNP of Brazil and India in 2016.
- Calculate the difference between the national incomes of developed and developing countries in 2016.
Advertisements
Solution
- USA’s national income was highest in 2016 and it was 1850 million US $.
- Comparing India and Brazil, Brazil had a higher national income in 1980.
- Comparing India and Brazil, India had a higher income in 2016.
- The difference between the GNP of Brazil and India in 2016 was 10 million US $.
- The difference between the national incomes of developed and developing countries in 2016 was about 1680 to 1690 million US $.
APPEARS IN
RELATED QUESTIONS
Mark the following in the outline map of Brazil supplied to you, write the names and give index

- Marajó Island
- Pico-De-Neblina
- Pantanal Wetland
- Drought Quadrilateral
- Caatinga
- Golden Lion-Tamarin
Mark the following in the outline map of Brazil supplied to you, write the names and give index:
(1) Marajo Island
(2) Pico-De-Neblina
(3) Pantanal Wetland
(4) Drought Quadrilateral
(5) Caatinga
(6) Golden Lion-Tamarin
India’s per capita income is less than Brazil due to ______.
The economies of India and Brazil are of the ______ type.
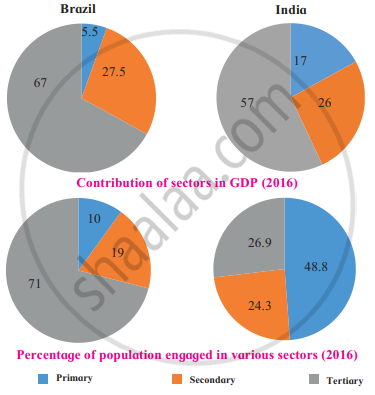
With the help of the pie chart given in the fig., tell what the contribution of secondary activities is to Brazil’s GDP?
Distinguish Between:
Occupations in India and Brazil.
Observe the following graph and answer the questions given below-

- Which country has a higher percent of the population engaged in primary activities?
- In which country is the contribution of tertiary sector greater in the GDP?
- In which country is the share of secondary activities more in the GDP?
- Can we say that Brazil is an agrarian economy like India? Give reasons.
- Which country has a higher percent of the population engaged in secondary activities?
- How much percent of population is engaged in tertiary activities in India?
India and Brazil are progressing in the fields of ______ education and industry.
In figure given below, the pie-charts show the contribution of each sector in the respective country’s GDP and the percentage of population engaged in various activities. Read both the pie-charts carefully and answer the following questions.

- Which country has a higher percentage of population engaged in primary activities?
- In which country is the contribution of tertiary sector greater in the GDP?
- In which country is the share of secondary activities more in the GDP?
- Can we say that Brazil is an agrarian economy like India? Give reasons.
Read the following graph and answer the questions:
India and Brazil
Contribution of sectors in national income and percentage of population engaged in the sector.

Questions:
- Name the sectors mentioned in the graph.
- Which sector contributes the highest in National income in India?
- How much percent of population is engaged in primary sector in Brazil?
- Out of given two countries, the share of primary sector to the national income is less.
- Which country's contribution of tertiary sector to the national income is less?
- In which sector 19% population of Brazil is engaged?
