Advertisements
Advertisements
Question
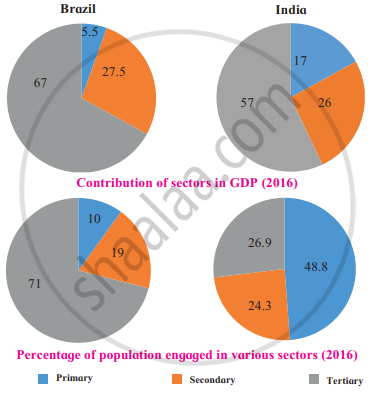
Observe the following graph and answer the questions given below-

- Which country has a higher percent of the population engaged in primary activities?
- In which country is the contribution of tertiary sector greater in the GDP?
- In which country is the share of secondary activities more in the GDP?
- Can we say that Brazil is an agrarian economy like India? Give reasons.
- Which country has a higher percent of the population engaged in secondary activities?
- How muchpercent of population is engaged in tertiary activities in India?
Advertisements
Solution
- India has a higher percentage of its population engaged in primary activities.
- In Brazil, the contribution of the tertiary sector is greater to the GDP.
- In Brazil, the share of secondary activities is higher in the GDP.
- No, we cannot say that Brazil is an agrarian economy like India because:
i. In Brazil, 71% of the population is engaged in the tertiary sector, while the contribution of this sector to GDP is 67%.
ii. This shows that it has a strong and rapidly growing service sector. - India has a higher percentage of its population engaged in secondary activities.
- In India, 26.9% of the population is engaged in tertiary activities.
RELATED QUESTIONS
Brazil’s economy is also of ---------------- type like that of India.
Mark the following in the outline map of Brazil supplied to you, write the names and give index

- Marajó Island
- Pico-De-Neblina
- Pantanal Wetland
- Drought Quadrilateral
- Caatinga
- Golden Lion-Tamarin
India’s per capita income is less than Brazil due to ______.
The economy of Brazil is mainly dependent on the ______ activities there.
Read the following graph and answer the questions:
Gross National Incomes (GNI) from 1960 to 2016 (in million US $)
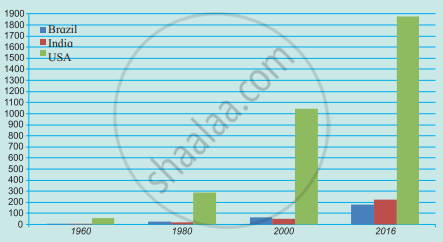
- Which country’s national income was highest in 2016 and was it how much?
- Comparing India and Brazil, which country had a higher national income in 1980?
- Comparing India and Brazil, which country had a higher income in 2016?
- Tell the difference between the GNP of Brazil and India in 2016.
- Calculate the difference between the national incomes of developed and developing countries in 2016.
Classify the following activities in by ticking (✓) in the respective column.
| Activities | Primary | Secondary | Tertiary |
| Television Broadcasting | |||
| Bee-keeping | |||
| Coir and Rope making | |||
| Jaggery-making | |||
| Producing blades of the plough. |
|||
| Construction | |||
| Extracting Iron Ore | |||
| Automobile Production | |||
| Rice Production | |||
| Teaching | |||
| Driving buses | |||
| Providing lodging and boarding facilities |
State whether right or wrong-
Per capita income of India is less than Brazil.
Write answer in one sentence-
Which type of economy is found in Brazil?
In figure given below, the pie-charts show the contribution of each sector in the respective country’s GDP and the percentage of population engaged in various activities. Read both the pie-charts carefully and answer the following questions.
- Which country has a higher percentage of population engaged in primary activities?
- In which country is the contribution of tertiary sector greater in the GDP?
- In which country is the share of secondary activities more in the GDP?
- Can we say that Brazil is an agrarian economy like India? Give reasons.
Read the following graph and answer the questions:
India and Brazil Contribution of sectors in national income and percentage of population engaged in the sector.

- Name the sectors mentioned in the graph.
- Which sector contributes the highest in National income in India?
- How much percent of population is engaged in primary sector in Brasil?
