Advertisements
Advertisements
Question
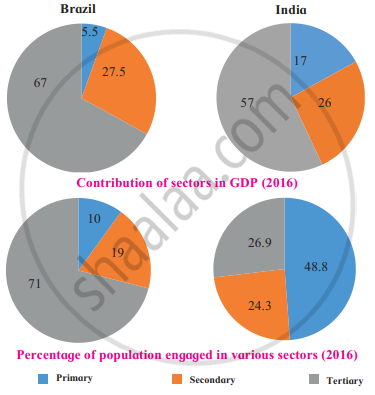
In figure given below, the pie-charts show the contribution of each sector in the respective country’s GDP and the percentage of population engaged in various activities. Read both the pie-charts carefully and answer the following questions.

- Which country has a higher percentage of population engaged in primary activities?
- In which country is the contribution of tertiary sector greater in the GDP?
- In which country is the share of secondary activities more in the GDP?
- Can we say that Brazil is an agrarian economy like India? Give reasons.
Advertisements
Solution
- India has a higher percentage of population engaged in primary activities (48.8%).
- The contribution of tertiary sector is greater in Brazil’s GDP (67%).
- The contribution of secondary activities is more in Brazil’s GDP (27.5%).
- Brazil is not an agrarian economy like India. This is because 71% of its population is engaged in the tertiary sector and it contributes 67% in GDP.
APPEARS IN
RELATED QUESTIONS
State whether the sentence is right or wrong and correct the wrong ones and rewrite the sentence
Like the Indian economy, the Brazilian economy is also of mixed type.
Mark the following in the outline map of Brazil supplied to you, write the names and give index

- Marajó Island
- Pico-De-Neblina
- Pantanal Wetland
- Drought Quadrilateral
- Caatinga
- Golden Lion-Tamarin
India’s per capita income is less than Brazil due to ______.
The economies of India and Brazil are of the ______ type.
Read the following graph and answer the questions:
Gross National Incomes (GNI) from 1960 to 2016 (in million US $)
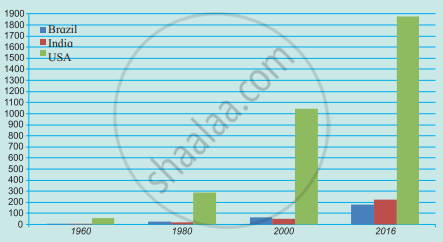
- Which country’s national income was highest in 2016 and was it how much?
- Comparing India and Brazil, which country had a higher national income in 1980?
- Comparing India and Brazil, which country had a higher income in 2016?
- Tell the difference between the GNP of Brazil and India in 2016.
- Calculate the difference between the national incomes of developed and developing countries in 2016.
Classify the following activities in by ticking (✓) in the respective column.
| Activities | Primary | Secondary | Tertiary |
| Television Broadcasting | |||
| Bee-keeping | |||
| Coir and Rope making | |||
| Jaggery-making | |||
| Producing blades of the plough. |
|||
| Construction | |||
| Extracting Iron Ore | |||
| Automobile Production | |||
| Rice Production | |||
| Teaching | |||
| Driving buses | |||
| Providing lodging and boarding facilities |
Which type of occupations gives a boost to the development of a country’s economy?
With the help of the pie chart given in the fig., tell what the contribution of secondary activities is to Brazil’s GDP?
India and Brazil are progressing in the fields of ______ education and industry.
A table regarding the ownership of various sectors in both the countries is given. Like Brazil, fill the details regarding India and complete the table.
| Sr. No. | India | Sector | Brazil |
| 1. | -- | Banking | Private and public both |
| 2. | -- | Railways | Private and public both |
| 3. | -- | Airways | Private and public both |
| 4. | -- | Electricity production | Largely public |
| 5. | -- | Iron and Steel Industry | Largely public |
| 6. | -- | Health | Private and public both |
| 7. | -- | Education | Largely public, little private |
| 8. | -- | Telecommunications | Private and public both |
On the basis of the information about the ownership of various sectors in both the countries given in the table, can you infer about the type of these economies?
