Advertisements
Advertisements
प्रश्न
Read the following graph and answer the questions:
Gross National Incomes (GNI) from 1960 to 2016 (in million US $)
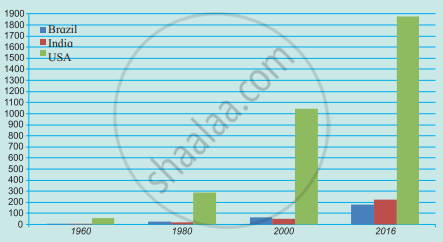
- Which country’s national income was highest in 2016 and was it how much?
- Comparing India and Brazil, which country had a higher national income in 1980?
- Comparing India and Brazil, which country had a higher income in 2016?
- Tell the difference between the GNP of Brazil and India in 2016.
- Calculate the difference between the national incomes of developed and developing countries in 2016.
Advertisements
उत्तर
- USA’s national income was highest in 2016 and it was 1850 million US $.
- Comparing India and Brazil, Brazil had a higher national income in 1980.
- Comparing India and Brazil, India had a higher income in 2016.
- The difference between the GNP of Brazil and India in 2016 was 10 million US $.
- The difference between the national incomes of developed and developing countries in 2016 was about 1680 to 1690 million US $.
APPEARS IN
संबंधित प्रश्न
Select the correct option and rewrite the sentence:
------------ is seen as one of the world’s major markets and contributor to economic growth of the world.
Draw a suitable Line graph with the help of the following statistical information and answer the following questions.
| Number of international tourists (in lakhs) | |||||
| International tourists (in lakhs) |
1995 | 2000 | 2005 | 2010 | 2015 |
| Brazil | 20 | 50 | 45 | 40 | 50 |
| India | 20 | 21 | 30 | 50 | 140 |
- In which year is the number of tourists maximum in India?
- In the year 2000, how many tourists visited Brazil?
- In which year do India and Brazil have the same number of international tourists?
The economies of India and Brazil are of the ______ type.
Give reasons.
There is mixed economy in Brazil and India.
Classify the following activities in by ticking (✓) in the respective column.
| Activities | Primary | Secondary | Tertiary |
| Television Broadcasting | |||
| Bee-keeping | |||
| Coir and Rope making | |||
| Jaggery-making | |||
| Producing blades of the plough. |
|||
| Construction | |||
| Extracting Iron Ore | |||
| Automobile Production | |||
| Rice Production | |||
| Teaching | |||
| Driving buses | |||
| Providing lodging and boarding facilities |
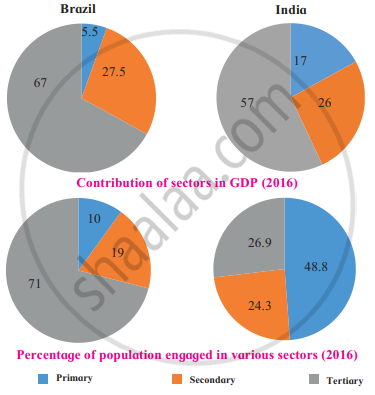
With the help of the pie chart given in the fig., tell what the contribution of secondary activities is to Brazil’s GDP?
Distinguish Between:
Occupations in India and Brazil.
Write answer in one sentence-
Which type of economy is found in Brazil?
Observe the following graph and answer the questions given below-

- Which country has a higher percent of the population engaged in primary activities?
- In which country is the contribution of tertiary sector greater in the GDP?
- In which country is the share of secondary activities more in the GDP?
- Can we say that Brazil is an agrarian economy like India? Give reasons.
- Which country has a higher percent of the population engaged in secondary activities?
- How much percent of population is engaged in tertiary activities in India?
In figure given below, the pie-charts show the contribution of each sector in the respective country’s GDP and the percentage of population engaged in various activities. Read both the pie-charts carefully and answer the following questions.
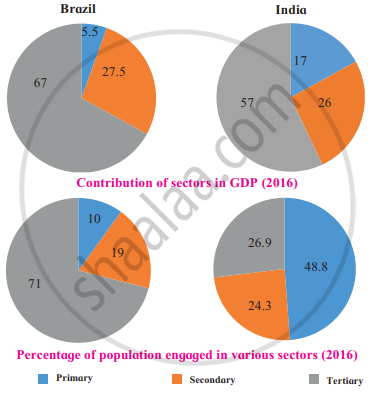
- Which country has a higher percentage of population engaged in primary activities?
- In which country is the contribution of tertiary sector greater in the GDP?
- In which country is the share of secondary activities more in the GDP?
- Can we say that Brazil is an agrarian economy like India? Give reasons.
