Advertisements
Advertisements
प्रश्न
Draw a suitable Line graph with the help of the following statistical information and answer the following questions.
| Number of international tourists (in lakhs) | |||||
| International tourists (in lakhs) |
1995 | 2000 | 2005 | 2010 | 2015 |
| Brazil | 20 | 50 | 45 | 40 | 50 |
| India | 20 | 21 | 30 | 50 | 140 |
- In which year is the number of tourists maximum in India?
- In the year 2000, how many tourists visited Brazil?
- In which year do India and Brazil have the same number of international tourists?
Advertisements
उत्तर
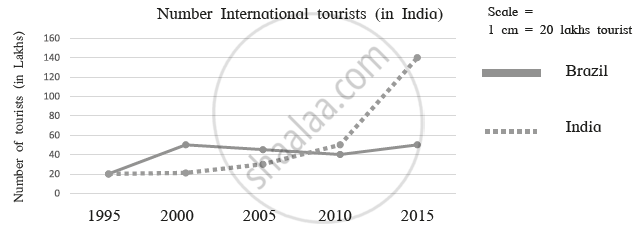
- 2015
- 50 lakh tourists
- In year 1995
APPEARS IN
संबंधित प्रश्न
Select the correct option and rewrite the sentence:
------------ is seen as one of the world’s major markets and contributor to economic growth of the world.
Brazil’s economy is also of ---------------- type like that of India.
State whether the sentence is right or wrong and correct the wrong ones and rewrite the sentence
Like the Indian economy, the Brazilian economy is also of mixed type.
The economy of Brazil is mainly dependent on the ______ activities there.
The economies of India and Brazil are of the ______ type.
Classify the following activities in by ticking (✓) in the respective column.
| Activities | Primary | Secondary | Tertiary |
| Television Broadcasting | |||
| Bee-keeping | |||
| Coir and Rope making | |||
| Jaggery-making | |||
| Producing blades of the plough. |
|||
| Construction | |||
| Extracting Iron Ore | |||
| Automobile Production | |||
| Rice Production | |||
| Teaching | |||
| Driving buses | |||
| Providing lodging and boarding facilities |
Which type of occupations gives a boost to the development of a country’s economy?
Distinguish Between:
Occupations in India and Brazil.
Observe the following graph and answer the questions given below-

- Which country has a higher percent of the population engaged in primary activities?
- In which country is the contribution of tertiary sector greater in the GDP?
- In which country is the share of secondary activities more in the GDP?
- Can we say that Brazil is an agrarian economy like India? Give reasons.
- Which country has a higher percent of the population engaged in secondary activities?
- How much percent of population is engaged in tertiary activities in India?
A table regarding the ownership of various sectors in both the countries is given. Like Brazil, fill the details regarding India and complete the table.
| Sr. No. | India | Sector | Brazil |
| 1. | -- | Banking | Private and public both |
| 2. | -- | Railways | Private and public both |
| 3. | -- | Airways | Private and public both |
| 4. | -- | Electricity production | Largely public |
| 5. | -- | Iron and Steel Industry | Largely public |
| 6. | -- | Health | Private and public both |
| 7. | -- | Education | Largely public, little private |
| 8. | -- | Telecommunications | Private and public both |
On the basis of the information about the ownership of various sectors in both the countries given in the table, can you infer about the type of these economies?
