Advertisements
Advertisements
Question
Distinguish Between:
Occupations in India and Brazil.
Advertisements
Solution
| Sr. No. | Aspect | Occupations in India | Occupations in Brazil |
| 1. | Agriculture | Agriculture is the main occupation of the people in India. Indian agriculture is mainly a subsistence type. | Agriculture is the main occupation of the people living in the highlands and coastal areas. |
| 2. | Mining | Mining is well-developed in the Chota Nagpur Plateau in India because it is rich in various types of minerals. Hence, it is the main occupation of people residing there. Moreover, coal, mineral oil and natural gas, stones like marble are also mined in India. | Mining in the western part of Brazil is very limited. In contrast, mining work has developed well in the Highland region due to the availability of minerals and increasing demand. Iron ore, manganese, nickel, copper, bauxite, tungsten, diamonds, etc., are various types of minerals found in Brazil. |
| 3. | Fishing | In India, marine fishing accounts for about 40% of the total annual production of fish, while inland fisheries contribute about 60% of the country’s total fish production. | Marine fishing is undertaken on a large scale in Brazil. Inland fishing is not developed here, even though there are a large number of rivers in Brazil. |
| 4. | Industries | The distribution of industries in India is highly uneven due to the uneven distribution of the necessary raw materials and power resources. | Large industries are mainly concentrated in the southern and south-eastern parts of Brazil. Although the north-eastern part of Brazil is the poorest, it is beginning to attract new investment in industries. |
APPEARS IN
RELATED QUESTIONS
Draw a suitable Line graph with the help of the following statistical information and answer the following questions.
| Number of international tourists (in lakhs) | |||||
| International tourists (in lakhs) |
1995 | 2000 | 2005 | 2010 | 2015 |
| Brazil | 20 | 50 | 45 | 40 | 50 |
| India | 20 | 21 | 30 | 50 | 140 |
- In which year is the number of tourists maximum in India?
- In the year 2000, how many tourists visited Brazil?
- In which year do India and Brazil have the same number of international tourists?
B) Read the following graph and answer the questions :
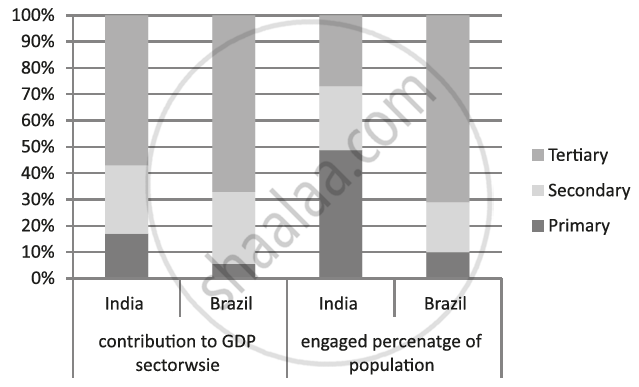
i) In which country is the contribution of tertiary sector higher ?
ii) In India, most people are engaged in which occupational sector?
iii) Which country has only 10% of the population engaged in primary sector?
iv) How much does tertiary sector contribute to the national income of India?
v) Which sector contributes the least in the Brazilian national income?
vi) What is the percentage of people engaged in the secondary sector in Brazil?
State whether the sentence is right or wrong and correct the wrong ones and rewrite the sentence
Like the Indian economy, the Brazilian economy is also of mixed type.
Mark the following in the outline map of Brazil supplied to you, write the names and give index

- Marajó Island
- Pico-De-Neblina
- Pantanal Wetland
- Drought Quadrilateral
- Caatinga
- Golden Lion-Tamarin
Mark the following in the outline map of Brazil supplied to you, write the names and give index:
(1) Marajo Island
(2) Pico-De-Neblina
(3) Pantanal Wetland
(4) Drought Quadrilateral
(5) Caatinga
(6) Golden Lion-Tamarin
Which type of occupations gives a boost to the development of a country’s economy?
State whether right or wrong-
Per capita income of India is less than Brazil.
Give geographical reasons for the following:
There are limitations on mining in the interior parts of Brazil.
India and Brazil are progressing in the fields of ______ education and industry.
Read the following graph and answer the questions:
India and Brazil
Contribution of sectors in national income and percentage of population engaged in the sector.

Questions:
- Name the sectors mentioned in the graph.
- Which sector contributes the highest in National income in India?
- How much percent of population is engaged in primary sector in Brazil?
- Out of given two countries, the share of primary sector to the national income is less.
- Which country's contribution of tertiary sector to the national income is less?
- In which sector 19% population of Brazil is engaged?
