Please select a subject first
Advertisements
Advertisements
The following is the time-distance graph of Sneha’s walking.

- When does Sneha make the least progress? Explain your reasoning.
- Find her average speed in km/hour.
Concept: undefined >> undefined
Draw a parallelogram ABCD on a graph paper with the coordinates given in Table I. Use this table to complete Tables II and III to get the coordinates of E, F, G, H and J, K, L, M.
| Point | (x, y) |
| A | (1, 1) |
| B | (4. 4) |
| C | (8, 4) |
| D | (5, 1) |
Table I
| Point | (0.5x, 0.5y) |
| E | (0.5, 0.5) |
| F | |
| G | |
| H |
Table II
| Point | (2x, 1.5y) |
| J | (2, 1.5) |
| K | |
| L | |
| M |
Table III
Draw parallelograms EFGH and JKLM on the same graph paper.
Plot the points (2, 4) and (4, 2) on a graph paper, then draw a line segment joining these two points.
Concept: undefined >> undefined
Advertisements
Extend the line segment on both sides to meet the coordinate axes. What are the coordinates of the points where this line meets the x-axis and the y-axis?
Concept: undefined >> undefined
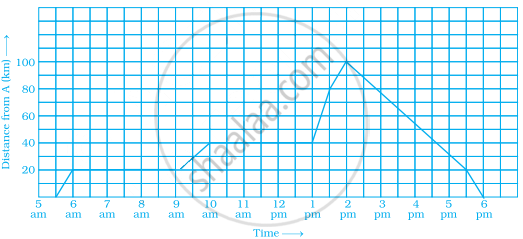
A man started his journey on his car from location A and came back. The given graph shows his position at different times during the whole journey.
- At what time did he start and end his journey?
- What was the total duration of journey?
- Which journey, forward or return, was of longer duration?
- For how many hours did he not move?
- At what time did he have the fastest speed?
Concept: undefined >> undefined
The following graph shows the journey made by two cyclists, one from town A to B and the other from town B to A.
- At what time did cyclist II rest? How long did the cyclist rest?
- Was cyclist II cycling faster or slower after the rest?
- At what time did the two cyclists meet?
- How far had cyclist II travelled when he met cyclist I?
- When cyclist II reached town A, how far was cyclist I from town B?

Concept: undefined >> undefined
Ajita starts off from home at 07.00 hours with her father on a scooter that goes at a uniform speed of 30 km/h and drops her at her school after half an hour. She stays in the school till 13.30 hours and takes an auto-rickshaw to return home. The rickshaw has a uniform speed of 10 km/h. Draw the graph for the above situation and also determine the distance of Ajita’s school from her house.
Concept: undefined >> undefined
Draw the line graph using suitable scale to show the annual gross profit of a company for a period of five years.
| Year | 1st | 2nd | 3rd | 4th | 5th |
| Gross Profit (in Rs) |
17,00,000 | 15,50,000 | 11,40,000 | 12,10,000 | 14,90,000 |
Concept: undefined >> undefined
The table shows the data collected for Dhruv’s walking on a road.
| Time (in minutes) |
0 | 5 | 10 | 15 | 20 | 25 |
| Distance (in km) |
0 | 0.5 | 1 | 1.25 | 1.5 | 1.75 |
- Plot a line graph for the given data using a suitable scale.
- In what time periods did Dhruv make the most progress?
Concept: undefined >> undefined
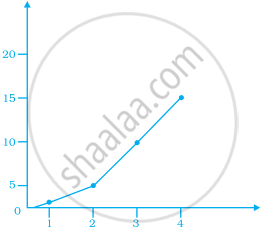
Observe the given graph carefully and complete the table given below.
| x | 1 | 2 | 3 | 4 | 5 |
| y |
Concept: undefined >> undefined
This graph shows the per cent of students who dropped out of school after completing High School. The point labelled A shows that, in 1996, about 4.7% of students dropped out.

- In which year was the dropout the rate highest? In which year was it the lowest?
- When did the per cent of students who dropped out of high school first fall below 5%?
- About what per cent of students dropped out of high school in 2007? About what per cent of students stayed in high school in 2008?
Concept: undefined >> undefined
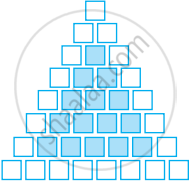
Observe the toothpick pattern given below:
(a) Imagine that this pattern continues. Complete the table to show the number of toothpicks in the first six terms.
| Pattern | 1 | 2 | 3 | 4 | 5 | 6 |
| Toothpicks | 4 | 13 |
(b) Make a graph by taking the pattern numbers on the horizontal axis and the number of toothpicks on the vertical axis. Make the horizontal axis from 0 to 10 and the vertical axis from 0 to 30.
(c) Use your graph to predict the number of toothpicks in patterns 7 and 8. Check your answers by actually drawing them.
(d) Would it make sense to join the points on this graph? Explain.
Concept: undefined >> undefined
Consider this input/output table.
| Input | 1 | 2 | 4 | 5 | 7 |
| Output | 2 | 5 | 11 | 14 | 20 |
- Graph the values from the table by taking Input along horizontal axis from 0 to 8 and Output along vertical axis from 0 to 24.
- Use your graph to predict the outputs for inputs of 3 and 8.
Concept: undefined >> undefined
This graph shows a map of an island just off the coast of a continent. The point labelled B represents a major city on the coast. The distance between grid lines represents 1 km.
Point A represents a resort that is located 5 km East and 3 km North of Point B. The values 5 and 3 are the coordinates of Point A. The coordinates can be given as the ordered pair (5, 3), where 5 is the horizontal coordinate and 3 is the vertical coordinate.
(i) On a copy of the map, mark the point that is 3 km East and 5 km North of Point B and label it S. Is Point S in the water or on the island? Is Point S in the same place as Point A?
(ii) Mark the point that is 7 km east and 5 km north of Point B and label it C. Then mark the point that is 5 km east and 7 km north of Point B and label it D. Are Points C and D in the same place? Give the coordinates of Points C and D.
(iii) Which point is in the water, (2, 7) or (7, 2)? Mark the point which is in water on your map and label it E.
(iv) Give the coordinates of two points on the island that are exactly 2 km from Point A.
(v) Give the coordinates of the point that is halfway between Points L and P.
(vi) List three points on the island with their x-coordinates greater than 8.
(vii) List three points on the island with a y-coordinate less than 4.
Concept: undefined >> undefined
The graph given below compares the price (in Rs) and weight of 6 bags (in kg) of sugar of different brands A, B, C, D, E, F.

- Which brand(s) costs/cost more than Brand D?
- Bag of which brand of sugar is the heaviest?
- Which brands weigh the same?
- Which brands are heavier than brand B?
- Which bag is the lightest?
- Which bags are of the same price?
Concept: undefined >> undefined
The points on the graph below represent the height and weight of the donkey, dog, crocodile, and ostrich shown in the drawing.

- What are the two variables represented in the graph?
- Which point represents each animals? Explain.
Concept: undefined >> undefined
The two graphs below compare Car A and Car B. The left graph shows the relationship between age and value. The right graph shows the relationship between size and maximum speed.
 |
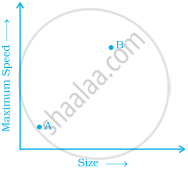 |
Use the graphs to determine whether each statement is true or false, and explain your answer.
- The older car is less valuable.
- The faster car is larger.
- The larger car is older.
- The faster car is older.
- The more valuable car is slower.
Concept: undefined >> undefined
Sonal and Anmol made a sequence of tile designs from square white tiles surrounding one square purple tile. The purple tiles come in many sizes. Three of the designs are shown below.
(a) Copy and complete the table
| Side Length of Purple Titles | 1 | 2 | 3 | 4 | 5 | 10 | 100 |
| Number of white Tiles in Border |
 |
 |
 |
(b) Draw a graph using the first five pairs of numbers in your table.
(c) Do the points lie on a line?
Concept: undefined >> undefined
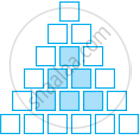
Sonal and Anmol then made another sequence of the designs. Three of the designs are shown below.
 |
 |
 |
(a) Complete the table.
| Rows, r | 4 | 6 | 8 |
| Number of white Tiles, w | 9 | ||
| Number of Purple Tiles, p | 1 |
(b) Draw a graph of rows and number of white tiles. Draw another graph of the number of rows and the number of purple tiles. Put the number of rows on the horizontal axis.
(c) Which graph is linear?
Concept: undefined >> undefined
All kites are rhombuses.
Concept: undefined >> undefined
Solve the linear equation:
`x/2 - 1/5 = x/3 + 1/4`
Concept: undefined >> undefined
