Advertisements
Advertisements
Question
Slope of a velocity-time graph gives
Options
the distance
the displacement
the acceleration
the speed
Advertisements
Solution
the acceleration
Explanation:
The slope of a velocity-time graph gives the rate of change of velocity or acceleration.
APPEARS IN
RELATED QUESTIONS
A farmer moves along the boundary of a square field of side 10 m in 40 s. What will be the magnitude of displacement of the farmer at the end of 2 minutes 20 seconds?
Differentiate between distance and displacement.
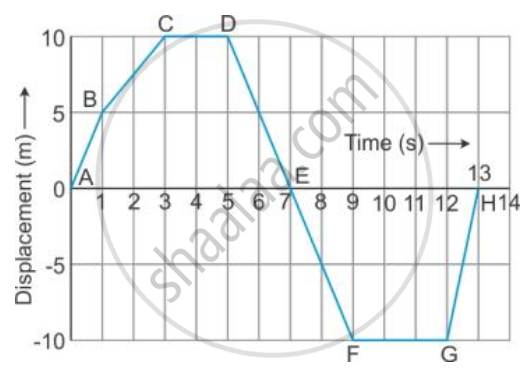
From the displacement-time graph of a cyclist given below in the Figure, find The displacement from the initial position at the end of 10 s,
A body at rest is made to fall from the top of a tower. Its displacement at different instants is given in the following table:
| Time (in s) | 0.1 | 0.2 | 0.3 | 0.4 | 0.5 | 0.6 |
| Displacement (in m) | 0.05 | 0.20 | 0.45 | 0.80 | 1.25 | 1.80 |
Draw a displacement-time graph and state whether the motion is uniform or non-uniform?
A bird sitting on a wire, flies, circles around and comes back to its perch. Explain the total distance it traversed during its flight and its eventual displacement.
Show the difference between distance and displacement with the help of a diagram.
The figure represents graphically the velocity of a car moving along a straight road over a period of 100 hours.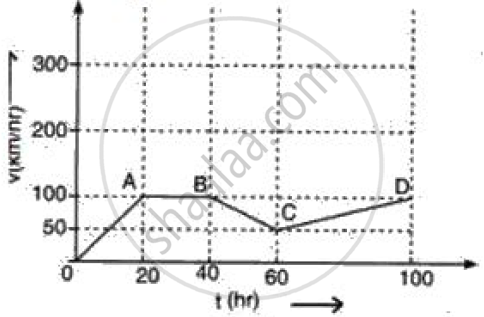
Calculate the distance travelled in the last 40 h.
Which of the following figures represent uniform motion of a moving object correctly?
A car starts from rest and moves along the x-axis with constant acceleration 5 ms–2 for 8 seconds. If it then continues with constant velocity, what distance will the car cover in 12 seconds since it started from the rest?
Using the following data, draw time - displacement graph for a moving object:
| Time (s) | 0 | 2 | 4 | 6 | 8 | 10 | 12 | 14 | 16 |
| Displacement (m) | 0 | 2 | 4 | 4 | 4 | 6 | 4 | 2 | 0 |
Use this graph to find average velocity for the first 4 s, for the next 4 s and for the last 6 s.
