Advertisements
Advertisements
Question
Figure X shows a trace of a sound wave produced by a particular tuning fork :
(a) On the graph paper given in Figure Y, draw a trace of the sound wave which has a higher frequency than that shown in figure X.
(b) On the graph paper show in Figure Z, draw a trace of the sound wave which has a larger amplitude than that shown in Figure X.
Advertisements
Solution
(a) Higher frequency sound wave in comparison to sound wave produced by the tuning fork in X.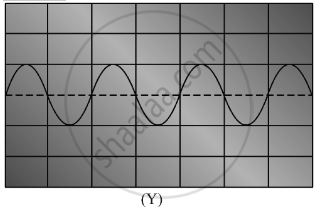
(b) Sound wave with larger amplitude in comparison to sound wave produced by the tuning fork in X.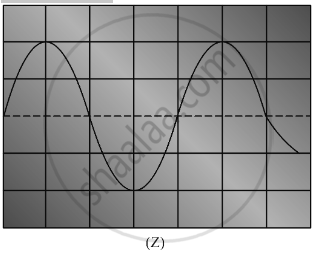
APPEARS IN
RELATED QUESTIONS
Explain how sound is produced by your school bell.
If 20 waves are produced per second, What is the frequency is hertz?
Describe a simple experiment to show that the prongs of a sound producing tuning fork are vibrating.
A device called oscillator is used to send waves along a stretched string. The string is 20 cm long, and four complete waves fit along its length when the oscillator vibrates 30 times per second. For the waves on the strings.
(a) what is their wavelength?
(b) what is their frequency
(c) what is their speed?
A key of mechanical piano is first struck gently and then struck again but much harder this time. In the second case :
The region in a sound wave, with higher pressure and density, is called ______ and that with low pressure and density is called ______.
Medium is ______ for generation of sound.
Describe an experiment to show that sound cannot travel through vaccum.
______ is produced when an object is set to vibrate.
The substance through which sound is transmitted is called ______.
