Advertisements
Advertisements
प्रश्न
Figure X shows a trace of a sound wave produced by a particular tuning fork :
(a) On the graph paper given in Figure Y, draw a trace of the sound wave which has a higher frequency than that shown in figure X.
(b) On the graph paper show in Figure Z, draw a trace of the sound wave which has a larger amplitude than that shown in Figure X.
Advertisements
उत्तर
(a) Higher frequency sound wave in comparison to sound wave produced by the tuning fork in X.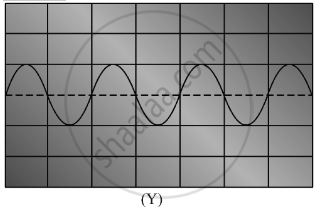
(b) Sound wave with larger amplitude in comparison to sound wave produced by the tuning fork in X.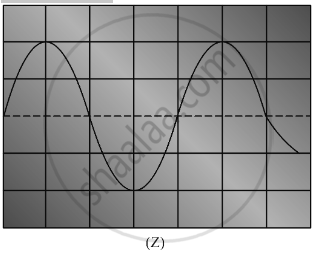
APPEARS IN
संबंधित प्रश्न
Explain how sound is produced by your school bell.
Fill in the blank.
Sound is produced when a body ______.
Describe an experiment to estimate the speed of sound in air.
What should an object do to produce sound?
Which object is vibrating when the following sounds are produced?
(i) The sound of a sitar
(ii) The sound of a tabla
(iii) The sound of a tuning fork
(iv) The buzzing of a bee or mosquito
(v) The sound of a flute
Draw the sketches of two waves A and B such that wave A has twice the wavelength and half the amplitude of wave B.
Medium is ______ for generation of sound.
Describe an experiment to show that sound cannot travel through vaccum.
Sound travels in the air if
Infrasound can be heard by
