Advertisements
Advertisements
प्रश्न
Figure X shows a trace of a sound wave produced by a particular tuning fork :
(a) On the graph paper given in Figure Y, draw a trace of the sound wave which has a higher frequency than that shown in figure X.
(b) On the graph paper show in Figure Z, draw a trace of the sound wave which has a larger amplitude than that shown in Figure X.
Advertisements
उत्तर
(a) Higher frequency sound wave in comparison to sound wave produced by the tuning fork in X.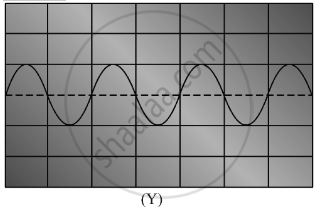
(b) Sound wave with larger amplitude in comparison to sound wave produced by the tuning fork in X.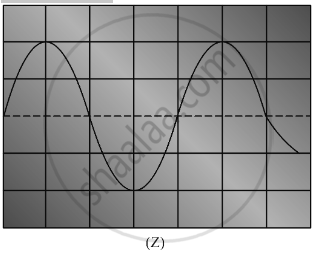
APPEARS IN
संबंधित प्रश्न
Explain how sound is produced by your school bell.
The frequency of a source of sound is 100 Hz. How many times does it vibrate in a minute?
What is the name of the strings which vibrate in our voice box when we talk?
What conclusion can be obtained from the observation that when the prongs of a sound making tuning fork touch the surface of water in a beaker, the water gets splashed?
If 20 waves are produced per second, What is the frequency is hertz?
Which object is vibrating when the following sounds are produced?
(i) The sound of a sitar
(ii) The sound of a tabla
(iii) The sound of a tuning fork
(iv) The buzzing of a bee or mosquito
(v) The sound of a flute
How is sound produced? Explain with the help of an example.
The total number of compressions and rarefactions produced per second in a sound wave is 1000. The frequency of the sound wave is __________.
Different sound notes have different ______.
Infrasound can be heard by
