Advertisements
Advertisements
Question
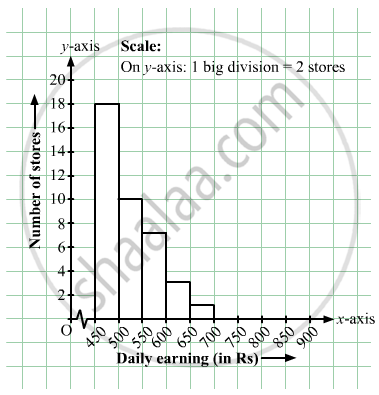
Draw a histogram for the daily earnings of 30 drug stores in the following table:
| Daily earnings (in Rs): | 450−500 | 500−550 | 550−600 | 600−650 | 650−700 |
| Numbers of stores: | 16 | 10 | 7 | 3 | 1 |
Advertisements
Solution
The class limits are represented along the x-axis and the frequencies along the y-axis on a suitable scale. Taking class intervals as bases and the corresponding frequencies as heights, the rectangles can be drawn to obtain the histogram of the given frequency distribution. The histogram is given below:
RELATED QUESTIONS
Given below is the frequency distribution of driving speeds (in km/hour) of the vehicles of 400 college students:
| Speed (in km/hr) | No. of Students |
| 20-30 | 6 |
| 30-40 | 80 |
| 40-50 | 156 |
| 50-60 | 98 |
60-70 |
60 |
Draw Histogram and hence the frequency polygon for the above data.
For which of these would you use a histogram to show the data?
(a) The number of letters for different areas in a postman’s bag.
(b) The height of competitors in an athletics meet.
(c) The number of cassettes produced by 5 companies.
(d) The number of passengers boarding trains from 7:00 a.m. to 7:00 p.m. at a station.
Give reasons for each.
Draw histogram for the following frequency distributions:
| Class Interval | 10 – 16 | 16 – 22 | 22 – 28 | 28 – 34 | 34 – 40 |
| Frequency | 15 | 23 | 30 | 20 | 16 |
Observe the following frequency polygon and write the answers of the questions below it.
- Which class has the maximum number of students?
- Write the classes having zero frequency.
- What is the class-mark of the class, having frequency of 50 students?
- Write the lower and upper class limits of the class whose class mark is 85.
- How many students are in the class 80-90?
| Electricity bill (₹) | 0 - 200 | 200 - 400 | 400 - 600 | 600 - 800 | 800 - 1000 |
| Families | 240 | 300 | 450 | 350 | 160 |
| Result (Percentage) | 30 - 40 | 40 - 50 | 50 - 60 | 60 -70 | 70 - 80 | 80 - 90 | 90 - 100 |
| No. of students | 7 | 33 | 45 | 65 | 47 | 18 | 5 |
Find the correct answer from the alternatives given.
|
No. of trees planted by each student |
1 - 3 | 4 - 6 | 7 - 9 | 10 - 12 |
| No. of students | 7 | 8 | 6 | 4 |
The above data is to be shown by a frequency polygon. The coordinates of the points to show number of students in the class 4-6 are . . . .
Number of workshops organized by a school in different areas during the last five years are as follows:
| Years | No. of workshops |
| 1995−1996 | 25 |
| 1996−1997 | 30 |
| 1997−1998 | 42 |
| 1998−1999 | 50 |
| 1999−2000 | 65 |
Draw a histogram representing the above data.
Draw a histogram to represent the following data:
| Monthly salary (in Rs) | Number of teachers |
| 5600−5700 | 8 |
| 5700−5800 | 4 |
| 5800−5900 | 3 |
| 5900−6000 | 5 |
| 6000−6100 | 2 |
| 6100−6200 | 3 |
| 6200−6300 | 1 |
| 6300−6400 | 2 |
Find the lower quartile, the upper quartile, the interquartile range and the semi-interquartile range for the following frequency distributions:
| Variate | 10 | 11 | 12 | 13 | 14 | 15 | 16 | 17 | 18 | 19 | 20 |
| Frequency | 1 | 2 | 3 | 1 | 2 | 4 | 2 | 1 | 1 | 2 | 1 |
Construct histograms for following frequency distribution:
| Class Interval | 110-119 | 120-129 | 130-139 | 140-149 | 150-159 |
| Frequency | 15 | 23 | 30 | 20 | 16 |
Following table present educational level (middle stage) of females in Arunachal pradesh according to 1981 census:
| Age group | Number of females (to the nearest ten) |
| 10 - 14 | 300 |
| 15 - 19 | 980 |
| 20 - 24 | 800 |
| 25 - 29 | 380 |
| 30 - 34 | 290 |
Draw a histogram to represent the above data.
Draw a histogram to represent the following data:
| Pocket money in ₹ | No. of Students |
| 150 - 200 | 10 |
| 200 - 250 | 5 |
| 250 - 300 | 7 |
| 300 - 350 | 4 |
| 350 - 400 | 3 |
(Use a graph paper for this question.) The daily pocket expenses of 200 students in a school are given below:
| Pocket expenses (in ₹) |
Number of students (frequency) |
| 0 - 5 | 10 |
| 5 - 10 | 14 |
| 10 - 15 | 28 |
| 15 - 20 | 42 |
| 20 - 25 | 50 |
| 25 - 30 | 30 |
| 30 - 35 | 14 |
| 35 - 40 | 12 |
Draw a histogram representing the above distribution and estimate the mode from the graph.
Identify the following data can be represented in a histogram?
The number of mountain climbers in the age group 20 to 60 in Tamil Nadu.
Identify the following data can be represented in a histogram?
The number of students in each class of a school
Histogram is a graph of a ________ frequency distribution
Prepare a histogram from the frequency distribution table obtained in question 93.
Show the following data by a frequency polygon:
| Electricity bill (₹) | Families |
| 200 – 400 | 240 |
| 400 – 600 | 300 |
| 600 – 800 | 450 |
| 800 – 1000 | 350 |
| 1000 – 1200 | 160 |
