Advertisements
Advertisements
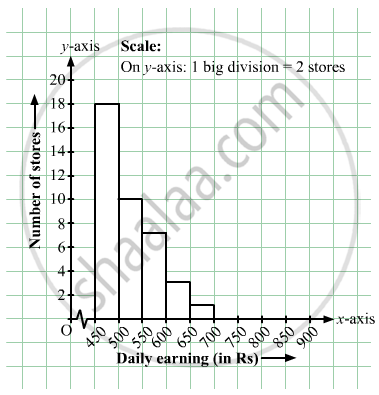
प्रश्न
Draw a histogram for the daily earnings of 30 drug stores in the following table:
| Daily earnings (in Rs): | 450−500 | 500−550 | 550−600 | 600−650 | 650−700 |
| Numbers of stores: | 16 | 10 | 7 | 3 | 1 |
Advertisements
उत्तर
The class limits are represented along the x-axis and the frequencies along the y-axis on a suitable scale. Taking class intervals as bases and the corresponding frequencies as heights, the rectangles can be drawn to obtain the histogram of the given frequency distribution. The histogram is given below:
संबंधित प्रश्न
Represent the following data by Histogram:
|
Price of Sugar per kg (in Rs.) |
Number of Weeks |
| 18-20 | 4 |
| 20-22 | 8 |
| 22-24 | 22 |
| 24-26 | 12 |
| 26-28 | 8 |
| 28-30 | 6 |
The histogram below represents the scores obtained by 25 students in a mathematics mental test. Use the data to:
- Frame a frequency distribution table.
- To calculate mean.
- To determine the Modal class.

| Electricity bill (₹) | 0 - 200 | 200 - 400 | 400 - 600 | 600 - 800 | 800 - 1000 |
| Families | 240 | 300 | 450 | 350 | 160 |
Number of workshops organized by a school in different areas during the last five years are as follows:
| Years | No. of workshops |
| 1995−1996 | 25 |
| 1996−1997 | 30 |
| 1997−1998 | 42 |
| 1998−1999 | 50 |
| 1999−2000 | 65 |
Draw a histogram representing the above data.
Construct a histogram for the following data:
| Monthly school fee (in Rs): | 30−60 | 60−90 | 90−120 | 120−150 | 150−180 | 180−210 | 210−240 |
| Number of schools: | 5 | 12 | 14 | 18 | 10 | 9 | 4 |
Find the lower quartile, the upper quartile, the interquartile range and the semi-interquartile range for the following frequency distributions:
| Shoe size | 5 | 6 | 7 | 8 | 9 | 10 | 11 |
| Frequency | 8 | 1 | 7 | 14 | 11 | 5 | 4 |
Construct histograms for following frequency distribution:
| Class Interval | 110-119 | 120-129 | 130-139 | 140-149 | 150-159 |
| Frequency | 15 | 23 | 30 | 20 | 16 |
Construct a frequency polygon without using a histogram for the following frequency distribution :
| Class Interval | 10-20 | 20-40 | 40-60 | 60-80 | 80-100 |
| Frequency | 9 | 17 | 15 | 20 | 14 |
Draw the Histogram and hence, the frequency polygon for the following frequency distribution:
| House Rent (In ₹ per month) | 400-600 | 600-800 | 800-1000 | 1000-1200 |
| Number of families | 200 | 240 | 300 | 50 |
Identify the following data can be represented in a histogram?
Production of cycles in different years
The total area of the histogram is _________ to the total frequency of the given data
In a village, there are 570 people who have cell phones. An NGO survey their cell phone usage. Based on this survey a histogram is drawn
Are people using cell phone for less than 1 hour?
Draw a histogram for the following data.
| Mid Value (x) | 15 | 25 | 35 | 45 | 55 | 65 | 75 |
| Frequency (f) | 12 | 24 | 30 | 18 | 26 | 10 | 8 |
Histogram shows the number of people owning the different number of books. Answer the question based on it.

The number of people having books more than 20 and less than 40 is ______.
In a histogram ______ are drawn with width equal to a class interval without leaving any gap in between.
From the histogram given on the right, we can say that 1500 males above the age of 20 are literate.

The following pictorial representation of data is a histogram.

The following table shows the classification of percentage of marks of students and the number of students. Draw frequency polygon from the table without drawing histogram:
| Result (Percentage) | Number of Students |
| 20 - 40 | 25 |
| 40 - 60 | 65 |
| 60 - 80 | 80 |
| 80 - 100 | 15 |
The table given below shows the runs scored by a cricket team during the overs of a match.
| Overs | Runs scored |
| 20 – 30 | 37 |
| 30 – 40 | 45 |
| 40 – 50 | 40 |
| 50 – 60 | 60 |
| 60 – 70 | 51 |
| 70 – 80 | 35 |
Use graph sheet for this question.
Take 2 cm = 10 overs along one axis and 2 cm = 10 runs along the other axis.
- Draw a histogram representing the above distribution.
- Estimate the modal runs scored.
