Advertisements
Advertisements
प्रश्न
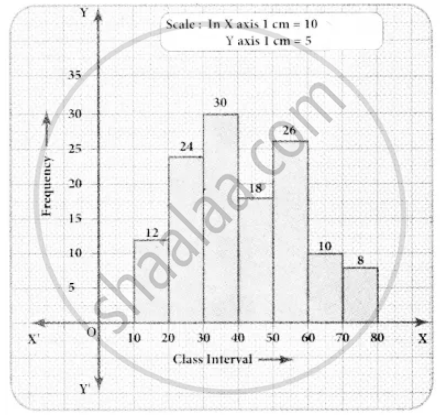
Draw a histogram for the following data.
| Mid Value (x) | 15 | 25 | 35 | 45 | 55 | 65 | 75 |
| Frequency (f) | 12 | 24 | 30 | 18 | 26 | 10 | 8 |
Advertisements
उत्तर
Since mid values are given, the given distributors is discontinuous.
Lower boundary lower limit – `1/2` (gap between the adjacent class interval)
= `15 - 1/2` (10) = 10
Upper boundary = Upper limit + `1/2` (gap between the adjacent class interval)
= `15 + 1/2` (10) = 20
The continuous distribution will he as folIows.
| Class interval | 10 − 20 | 20 − 30 | 30 − 40 | 40 − 50 | 50 − 60 | 60 − 70 | 70 − 80 |
| Frequency | 12 | 24 | 30 | 18 | 26 | 10 | 8 |
APPEARS IN
संबंधित प्रश्न
Time alloted for the preparation of an examination by some students is shown in the table. Draw a histogram to show the information.
| Time (minutes) | 60 - 80 | 80 - 100 | 100 - 120 | 120 - 140 | 140 - 160 |
| No. of students | 14 | 20 | 24 | 22 | 16 |
The age groups and the number of persons in the age groups, who donated blood in blood donation camp is given below. Find the measures of central angles to show the information by a pie diagram.
| Age group (Years) | 20-25 | 25-30 | 30-35 | 35-40 |
| No of persons | 80 | 60 | 35 | 25 |
Draw a histogram of the following data:
| Class interval: | 10−15 | 15−20 | 20−25 | 25−30 | 30−35 | 34−40 |
| Frequency: | 30 | 98 | 80 | 58 | 29 | 50 |
Construct histograms for following frequency distribution:
| Class Interval | 110-119 | 120-129 | 130-139 | 140-149 | 150-159 |
| Frequency | 15 | 23 | 30 | 20 | 16 |
Construct histograms for following frequency distribution:
| Class Interval | 130-140 | 140-150 | 150-160 | 160-170 | 170-180 |
| Frequency | 24 | 16 | 29 | 20 | 11 |
In a village, there are 570 people who have cell phones. An NGO survey their cell phone usage. Based on this survey a histogram is drawn
How many people use the cell phone for less than 3 hours?
In a village, there are 570 people who have cell phones. An NGO survey their cell phone usage. Based on this survey a histogram is drawn
How many of them use the cell phone for more than 5 hours?
Draw a histogram for the given frequency distribution
| Age | 41 − 45 | 46 − 50 | 51 − 55 | 56 − 60 | 61 − 65 | 66 − 70 | 71 − 75 |
| Frequency | 4 | 9 | 17 | 25 | 15 | 8 | 2 |
Form a continuous frequency distribution table and draw histogram from the following data.
| Age (in years) | No. of persons |
| Under 5 | 1 |
| Under 10 | 12 |
| Under 15 | 19 |
| Under 20 | 26 |
| Under 25 | 27 |
| Under 30 | 35 |
| Under 35 | 38 |
| Under 40 | 45 |
| Under 45 | 48 |
| Under 50 | 53 |
The top speeds of thirty different land animals have been organised into a frequency table. Draw a histogram for the given data.
| Maximum Speed (km/h) | Frequency |
| 10 – 20 | 5 |
| 20 – 30 | 5 |
| 30 – 40 | 10 |
| 40 – 50 | 8 |
| 50 – 60 | 0 |
| 60 – 70 | 2 |
