Advertisements
Advertisements
Question
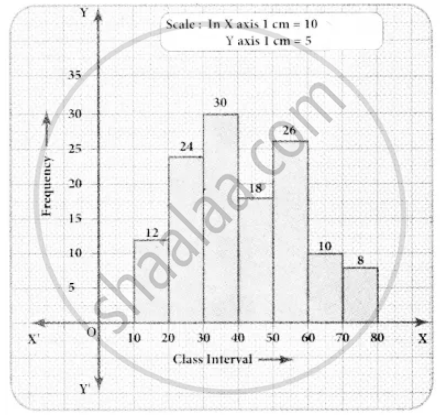
Draw a histogram for the following data.
| Mid Value (x) | 15 | 25 | 35 | 45 | 55 | 65 | 75 |
| Frequency (f) | 12 | 24 | 30 | 18 | 26 | 10 | 8 |
Advertisements
Solution
Since mid values are given, the given distributors is discontinuous.
Lower boundary lower limit – `1/2` (gap between the adjacent class interval)
= `15 - 1/2` (10) = 10
Upper boundary = Upper limit + `1/2` (gap between the adjacent class interval)
= `15 + 1/2` (10) = 20
The continuous distribution will he as folIows.
| Class interval | 10 − 20 | 20 − 30 | 30 − 40 | 40 − 50 | 50 − 60 | 60 − 70 | 70 − 80 |
| Frequency | 12 | 24 | 30 | 18 | 26 | 10 | 8 |
APPEARS IN
RELATED QUESTIONS
The weekly wages (in Rs) of 30 workers in a factory are.
830, 835, 890, 810, 835, 836, 869, 845, 898, 890, 820, 860, 832, 833, 855, 845, 804, 808, 812, 840, 885, 835, 835, 836, 878, 840, 868, 890, 806, 840
Using tally marks make a frequency table with intervals as 800 − 810, 810 − 820 and so on.
Draw a histogram for the frequency table made for the data in Question 3 and answer the following questions.
(1) Which group has the maximum number of workers?
(2) How many workers earn Rs 850 and more?
(3) How many workers earn less than Rs 850?
Observe the following frequency polygon and write the answers of the questions below it.
- Which class has the maximum number of students?
- Write the classes having zero frequency.
- What is the class-mark of the class, having frequency of 50 students?
- Write the lower and upper class limits of the class whose class mark is 85.
- How many students are in the class 80-90?
The following table shows the investment made by some families. Show
the information by a histogran.
| Investment (Thousand Rupees) |
10-15 | 15-20 | 20-25 | 25-30 | 30-35 |
| No. of families | 30 | 50 | 60 | 55 | 15 |
The following frequency distribution table shows marks obtained by 180 students in Mathematics examination.
| Marks | No. of students |
| 0 - 10 | 25 |
| 10 - 20 | x |
| 20 - 30 | 30 |
| 30 - 40 | 2x |
| 40 - 50 | 65 |
Find the value of x. Also draw a histogram representing the above information.
Construct histograms for following frequency distribution:
| Class Mark | 6 | 12 | 18 | 24 | 30 | 36 |
| Frequency | 8 | 12 | 15 | 18 | 25 | 7 |
Identify the following data can be represented in a histogram?
The number of mountain climbers in the age group 20 to 60 in Tamil Nadu.
Identify the following data can be represented in a histogram?
The number of votes polled from 7 am to 6 pm in an election
Draw a histogram for the following data.
| Class Interval | 0 − 10 | 10 − 20 | 20 − 30 | 30 − 40 | 40 − 50 | 50 − 60 |
| No. of students | 5 | 15 | 23 | 20 | 10 | 7 |
Represent the following data by histogram:
| Price of Sugar (per kg in ₹) | Number of Weeks |
| 18 – 20 | 4 |
| 20 – 22 | 8 |
| 22 – 24 | 22 |
| 24 – 26 | 12 |
| 26 – 28 | 6 |
| 28 – 30 | 8 |
