Topics
National Income and Related Aggregates
- Macroeconomics Vs Microeconomics
- Representative Goods and Sectors
- Macroeconomic Agents and Government Role
- Emergence of Macroeconomics
- Context of the Present Book of Macroeconomics
- Meaning of Economic Wealth and Final Goods
- Stocks, Flows, and Depreciation
- Capital Formation, Trade-off & Circular Flow of Income
- Circular Flow of Income and Methods of Calculating National Income
- Output Method/Product Method
- Expenditure Method
- Income Method
- Factor Cost, Basic Prices and Market Prices
- Some Macroeconomic Identities
- National Disposable Income
- Private Income
- National Income Aggregates
- Real GDP and Nominal GDP
- GDP and Welfare
Introductory Macroeconomics
Introduction
- A Simple Economy
- Central Problems of an Economy
- Concepts of Production Possibility Frontier
- Organisation of Economic Activities
- Positive and Normative Economics
- Macroeconomics Vs Microeconomics
Development Experience (1947-90) and Economic Reforms since 1991
- India's Economy Before Independence
- Low Level of Economic Development Under the Colonial Rule
- Agricultural Sector in India
- Industrial Sector
- Foreign Trade of India
- Demographic Condition
- Occupational Structure
- Infrastructure
- Post-Independence Economic Systems and Planning
- Five Year Plans (FYP)
- Agriculture
- Industry and Trade
- Trade Policy: Import Substitution
- The 1991 Economic Crisis and Reforms
- Background of the New Economic Policy
- Liberalisation
- Privatisation
- Globalisation
- World Trade Organisation (WTO)
- Impact of the Economic Reforms
Current Challenges Facing Indian Economy
- Concept of Human Capital
- Sources of Human Capital
- Human Capital and Economic Growth
- Human Capital and Human Development
- State of Human Capital Formation in India
- Growth of Education Sector in India
- Challenges and Future Prospects in Education
- Rural Development in India
- Credit and Marketing in Rural Areas
- Agricultural Market System
- Diversification into Productive Activities
- Sustainable Development and Organic Farming
- The Nature and Importance of Work in Society
- Workers and Employment
- Participation of People in Employment
- Self-employed and Hired Workers
- Employment in Firms, Factories and Offices
- Growth and Changing Structure of Employment
- Informalisation of Indian Workforce
- Concept of Unemployment
- Government and Employment Generation
- Environment and Sustainable Development in India
- State of India’s Environment
- Concept of Sustainable Development
- Strategies for Sustainable Development
Money and Banking
- Concept of Money
- Functions of Money
- Demand for Money and Supply of Money
- Money Creation by Banking System
- Limits to Credit Creation and Money Multiplier
- Policy Tools To Control Money Supply
- Demand and Supply for Money : A Detailed Discussion
- The Transaction Motive
- The Speculative Motive
- Various Measures of Supply of Money
- Narrow and Broad Money
- Demonetisation
Theory of Consumer Behaviour
- Consumer Behaviour: The Problem of Choice
- Basic Concepts of Microeconomics > Utility
- Cardinal Approach (Utility Analysis)
- Derivation of Demand Curve in the Case of a Single Commodity
- Ordinal Utility Analysis/Indifference Curve Analysis
Indian Economic Development
Determination of Income and Employment
- Aggregate Demand and Its Components
- Consumption
- Investment
- Determination of Income in Two-sector Model
- Determination of Equilibrium Income in the Short Run
- Macroeconomic Equilibrium with Price Level Fixed
- Effect of an Autonomous Change in Aggregate Demand on Income and Output
- The Multiplier Mechanism
- Paradox of Thrift
- Equilibrium Output and Employment
Development Experience of India – a Comparison with Neighbours
Introductory Microeconomics
Production and Costs
- Production Function
- Basics of Production Theory
- Variation of Output in the Short-Run Returns to a Factor
- Relation Between Total, Average and Marginal Product
- Law of Variable Proportions
- Average and Marginal Physical Products
- Changes in Production
- Cost - Fixed Cost
- Cost -variable Cost
- Behaviour of Cost in the Short - Run
- Relationship Between Average Variable Cost and Average Total Cost and Marginal Cost
- Concept of Opportunity Cost
- Marginal Revenue
- Producer's Equilibrium
- Law of Supply
- Market Supply Schedule
- Distinguish between Stock and Supply
- Determinants of Supply
- Movements Along and Shifts in Supply Curve
- Measurement of Elasticity of Supply > Percentage Method
- Methods of Measurement of National Income
- Cost Concepts > Marginal Cost
- The Law of Diminishing Marginal Product
- Shapes of Product Curves
- Costs in Long Run Period
- Returns to Scale
The Theory of the Firm Under Perfect Competition
- Concept of Market
- Market Equilibrium
- Determination of Market Equilibrium
- Effects of Changes (Shifts) in Demand on Equilibrium Price and Equilibrium Quantity
- Perfect Competition
- Imperfect Competition
- Classification of Market Structure
- Oligopoly
- Market Forms - Perfect Oligopoly
- Market Forms - Imperfect Oligopoly
- Equilibrium Price
- Applications of Tools of Demand and Supply Price Control
- Price Ceiling
- Price Floor
- Revenue Concepts
- Profit Maximisation Objective
- Determinants of a Firm’s Supply Curve
- Market Supply Schedule
- Price Elasticity of Supply
Government Budget and the Economy
Market Equilibrium
- Simple Monopoly in the Commodity Market
- Other Non - Perfectly Competitive Markets
Balance of Payments
- Open Economy and Its Linkages
- Concept of Balance of Payments
- Current Account
- Capital Account
- Balance of Payments Surplus and Deficit
- Foreign Exchange Market
- Foreign Exchange Rate
- Determination of the Exchange Rate
- Merits and Demerits of Flexible and Fixed Exchange Rate Systems
- Managed Floating Exchange Rate System
Introduction: Ordinal Utility
Ordinal utility means a consumer can rank preferences—like first, second, and third—but cannot say “how much” more they like one option over another.
For example, you can say you prefer pizza to pasta and pasta to salad, but you can’t say pizza gives you exactly twice as much ‘utility’ as salad.
Definition: Indifference Curve Analysis
According to Hicks, "It is the locus of the points representing parts of quantities between which the individual is indifferent and so it is termed as an indifference curve."
According to Meyres, "An indifference curve may be defined as a schedule of various combinations of goods which will be equally satisfactory to the consumer concerned."
According to Ferguson, "An indifference curve is a combination of goods, each of which yields the same level of total utility for which the consumer is indifferent." According to Leftwich, "A single indifference curve shows the different combinations of X and Y that yield equal satisfaction to the consumer."
Origin
Italian economist Pareto first drew these curves; British economists Hicks and Allen developed the theory further (1930s).
Indifference Schedule
Suppose a consumer chooses between “Food” and “Clothing”. All the following bundles give the same satisfaction:
| Combination | Food (units) | Clothing (units) | Marginal Rate of Substitution (MRS) |
|---|---|---|---|
| A | 1 | 10 | – |
| B | 2 | 7 | 3:1 |
| C | 3 | 5 | 2:1 |
| D | 4 | 4 | 1:1 |
Indifference Curve
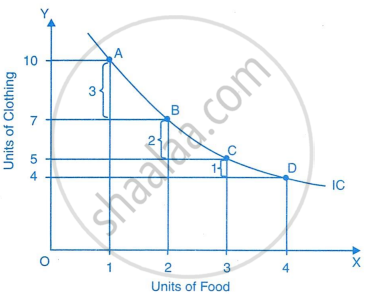
- Axes: X-axis: Food, Y-axis: Clothing
- Each point (A, B, C, D) is a bundle with equal satisfaction.
- Connecting these points forms the “Indifference Curve”.
- Any point on the same curve means the consumer is “indifferent” (no preference).
Indifference Map
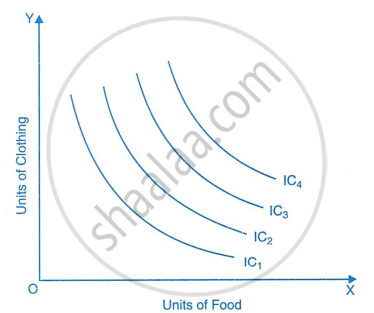
- A single indifference curve = one level of satisfaction.
- Multiple indifference curves (IC1, IC2, IC3…) = indifference map, where curves farther from the origin mean higher satisfaction.
- Each curve shows different satisfaction levels; none ever cross.
Marginal Rate of Substitution (MRS)
- Definition: The quantity of good Y given up for 1 more unit of X, satisfaction unchanged.
- Formula:
\[MRS_{XY}=\frac{-\Delta Y}{\Delta X}\] - Diminishes as more of X is consumed (curve flattens).
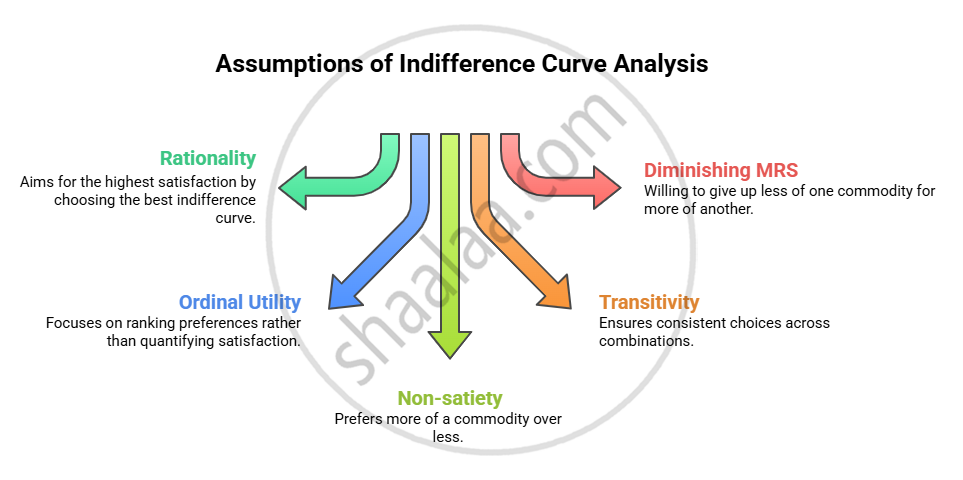
Assumptions
Real-Life Application
Imagine choosing between extra study hours and hours spent playing a sport. Your “indifference curve” links combinations that make you equally happy!
Key Point Summary
- Indifference curves analyse choices using preference rankings (ordinal utility), not absolute numbers.
- The slope (MRS) tells us the consumer’s willingness to substitute between goods, always decreasing along the curve.
- Higher curves = higher satisfaction.
Test Yourself
Related QuestionsVIEW ALL [16]
Identify the correct pair of items from the following Columns I and II:
| Columns I | Columns II |
| (1) Marginal Rate of Substitution (MRS) | (a) It states the real employment of the consumer from which he can purchase certain qualitative bundles of three goods at given price. |
| (2) Consumer's Bundle | (b) It refers to the number of units of good Y which the consumer is willing to gain for an additional unit of goodX. |
| (3) Budget set | (c) It is quantitative combination of those bundles which a consumer can purchase from his given income at prevailing market prices. |
| (4) Consumer Budget | (d) It is a qualitative combination of three goods which can be purchased by a consumer from his given expenses at given prices. |
Identify the correctly matched statements from Column I to that of Column II:
| Column I | Column II |
| 1. Total revenue | (a) Sum of marginal revenues |
| 2. MC > ATC | (b) Stage III |
| 3. MP is negative. | (c) Qx = f(L, K) |
| 4. Production Function | (d) ATC must rise. |
