Topics
Introduction to Micro and Macro Economics
- Introduction to Microeconomics and Macroeconomics
- Father of Econometrics: Ragnar Frisch
- Microeconomics
- Macroeconomics
- Macroeconomics Vs Microeconomics
Micro Economics
Introduction to Micro Economics
- Analysis of Market Structure
- Microeconomics
- Micro Economics - Slicing Method
- Use of Marginalism Principle in Micro Economics
- Micro Economics - Price Theory
- Micro Economic - Price Determination
- Micro Economics - Working of a Free Market Economy
- Micro Economics - International Trade and Public Finance
- Welfare Economics
- Micro Economics - Useful to Government
- Assumption of Micro Economic Analysis
Consumers Behavior
Analysis of Demand and Elasticity of Demand
Analysis of Supply
Types of Market and Price Determination Under Perfect Competition
Factors of Production
- Factors of Production - Feature of Capital
- Factors of Production
Macro Economics
Utility Analysis
- Basic Concepts of Microeconomics > Utility
- Commodities and Their Specific Utility for Individuals
- Total Utility and Marginal Utility
- Law of Diminishing Marginal Utility
- Paradox of Value
- Relationship Between Marginal Utility and Price
- Indifference Curve Analysis by Hicks and Allen
Introduction to Macro Economics
- Macroeconomics
- Allocation of Resource and Economic Variable
National Income
Determinants of Aggregates
- Total Demand for Good and Services
- Concept of Aggregate Demand and Aggregate Supply
- Consumption
- Investment Demand
- Government Demand
- Foreign Demand
- Difference Betweeen Export and Import
- Effect of Population of Consumption Expediture
- Types of Investment Expenditure
- Micro Eco-Equilibrium
Money
- Concept of Money
- Functions of Money
- Standard of Deferred Payment
- Standard of Transfer Payment
- Money - Store of Value
- Barter system
- Monetary Payments
- Qualities of Good Money
Commercial Bank
Central Bank
- Central Bank
- Central Bank Function - Banker's Bank
- Central Bank as a Controller of Credit
- Monetary Function of Central Bank
- Non Monetary Function of Central Bank
- Methods of Credit Control by the Central Bank
- Repo Rate and Reverse Repo Rate
- Central Bank Function - Goverment Bank
Public Economics
- Introduction of Public Economics
- Features of Public Economics
- Government Budget
- Objectives of Government Budget
- Features of Government Budget
- Public Economics - Budget (1 Year)(1 April to 31 March)
- Types of Budget
- Taxable Income
- Budgetary Accounting in India
- Budgetary Accounting - Consolidated , Contingency and Public Fund
- Components (Structure) of the Government Budget
- Factor Influencing Government Budget
Demand Analysis
Elasticity of Demand
- Introduction to Elasticity of Demand
- Income Elasticity of Demand
- Cross Elasticity of Demand
- Price Elasticity of Demand
- Perfectly Elastic Demand
- Perfectly Inelastic Demand
- Unitary Elastic Demand
- Relatively Elastic Demand
- Relatively Inelastic Demand
- Methods of Measuring Price Elasticity of Demand
- Linear Demand Curve
- Non-Linear Demand Curve
- Factors Influencing the Elasticity of Demand
- Importance of Elasticity of Demand
- Determinants of Price Elasticity of Demand
Supply Analysis
Forms of Market
- Concept of Market
- Classification of Market > Based on Place
- Classification of Market > Based on Place
- Classification of Market > Based on Time
- Classification of Market > Based on Competition
- Perfect Competition
- Price Determination Under Perfect Competition
- Imperfect Competition
- Monopoly
- Monopsony
- Oligopoly
- Monopolistic Competition
Index Numbers
- Index Numbers
- Features of Index Numbers
- Types of Index Numbers
- Index Numbers Used by Government of India
- Significance of Index Numbers
- Rebasing of GDP, IIP, and WPI
- Construction of Index Numbers
- Methods of Constructing Index Numbers > Simple Index Number
- Price Index Number
- Quantity Index Number
- Value Index Number
- Methods of Constructing Index Numbers > Weighted Index Number
- Laaspeyre’s Price Index Number
- Paasche’s Price Index Number
- Concepts of Sensex and Nifty
- Crops in India's Agricultural and Industrial Production Index
- Limitations of Index Numbers
National Income
- Concept of National Income
- Features of National Income
- Circular Flow of National Income
- Circular Flow of Income in a Two-Sector Economy
- Circular Flow of Income in a Three-Sector Economy
- Four Sector Model of Circular Income
- Different Concepts of National Income
- Concept of Green GNP
- Methods of Measurement of National Income
- Output Method/Product Method
- Income Method
- Expenditure Method
- Concept of Mixed income
- Difficulties in the Measurement of National Income
- Significance or Importance of National Income
Public Finance in India
- Introduction to Public Finance
- Difference Between Public Finance and Private Finance
- Public Expenditure
- Important Social Welfare Schemes by the Government
- Structure of Public Finance > Public Revenue
- Public Revenue > Taxes
- Types of Taxes
- Public Revenue > Non-tax Revenue
- Structure (Types) of Public Debt
- Fiscal Policy
- Structure of Public Finance > Financial Administration
- GST(Economics)
- Government Budget
- Revenue and Capital Budgets
- Types of Budget
- Importance of Budget
Money Market and Capital Market in India
- Concept of Financial Market
- Money Market
- Structure of Money Market in India > Organized Sector
- Structure of Money Market in India > Organized Sector
- Reserve Bank of India (RBI)
- Commercial Banks
- Co-operative Banks
- Development Financial Institutions (DFIs)
- Discount and Finance House of India (DFHI)
- Structure of Money Market in India > Unorganized Sector
- Money Market
- Role of Money Market in India
- Problems of the Indian Money Market
- Reforms Introduced in the Money Market
- Recent Developments in Banking Sector
- Capital Market
- Structure of Capital Market in India
- Role of Capital Market in India
- Problems of the Capital Market
- Regional Stock Exchanges in India
- Reforms Introduced in the Capital Market
- Economic Policy in an Economy
Foreign Trade of India
- India’s Trade Relations Before 1947
- Internal Trade
- Foreign Trade of India
- Types of Foreign Trade
- Role of Foreign Trade
- India’s Recent Trade Relations with China and Japan
- Composition of India’s Foreign Trade
- India’s Foreign Trade Share in GNI
- Composition of India's Imports
- Composition of India's Exports
- Direction of India’s Foreign Trade
- Trends in India’s Foreign Trade since 2001
- Concept of Balance of Payments
- Balance of Trade
- Member Nations of OPEC and OECD
Estimated time: 17 minutes
CBSE: Class 12
Tamil Nadu Board of Secondary Education: Class 12
National Testing Agency: Class 12
Tamil Nadu Board of Secondary Education: Class 12
National Testing Agency: Class 12
Consumption Function
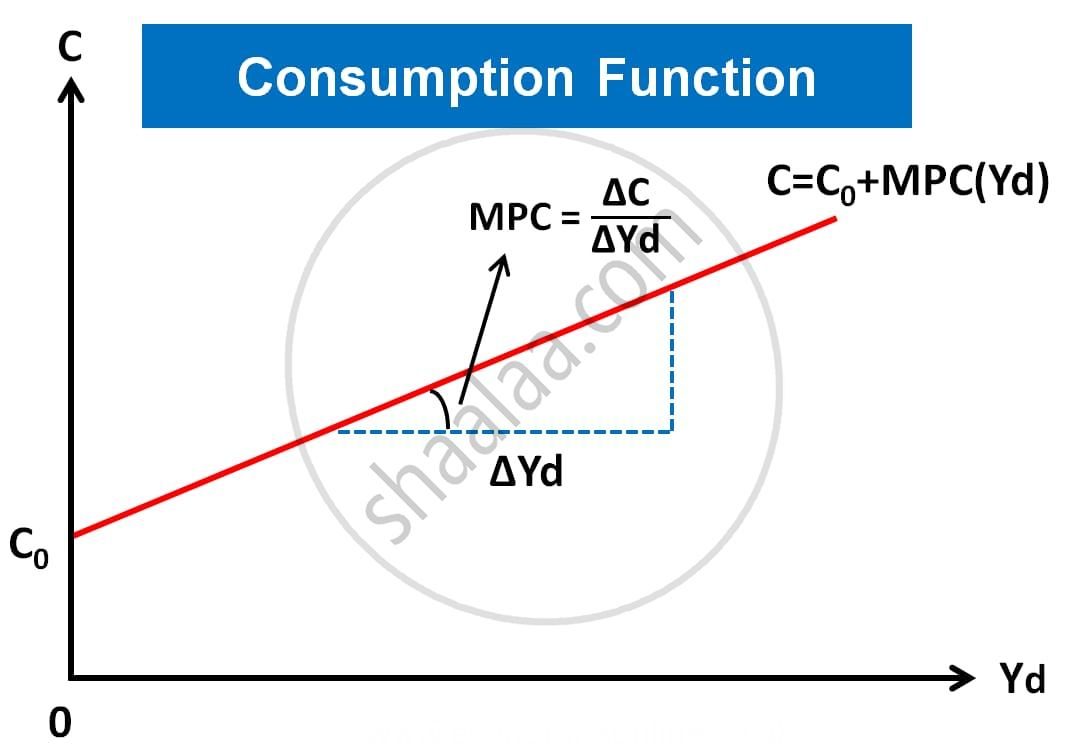
- Shows how consumption changes as income changes.
- At zero income, consumption does not become zero — households still spend (autonomous consumption).
- The consumption curve starts above the origin and slopes upward.
CBSE: Class 12
Tamil Nadu Board of Secondary Education: Class 12
National Testing Agency: Class 12
Tamil Nadu Board of Secondary Education: Class 12
National Testing Agency: Class 12
Formula: Consumption Function
\[C=\bar{C}+cY\]
CBSE: Class 12
Tamil Nadu Board of Secondary Education: Class 12
National Testing Agency: Class 12
Tamil Nadu Board of Secondary Education: Class 12
National Testing Agency: Class 12
Autonomous Consumption
- Consumption that takes place even when income is zero.
- Represented by the Y-intercept of the consumption curve.
- It is independent of income.
CBSE: Class 12
Induced Consumption
- Consumption that depends on income.
- Represented by cY in the consumption function.
- When income rises by ₹1, induced consumption rises by MPC (c).
CBSE: Class 12
Tamil Nadu Board of Secondary Education: Class 12
National Testing Agency: Class 12
Tamil Nadu Board of Secondary Education: Class 12
National Testing Agency: Class 12
Formula: Marginal Propensity to Consume (MPC)
- Change in consumption due to a unit change in income.
- Value always lies between 0 and 1 (inclusive).
\[MPC=c=\frac{\Delta C}{\Delta Y}\]
CBSE: Class 12
Tamil Nadu Board of Secondary Education: Class 12
National Testing Agency: Class 12
Tamil Nadu Board of Secondary Education: Class 12
National Testing Agency: Class 12
Formula: Marginal Propensity to Save (MPS)
- Change in saving due to a unit change in income.
- MPC and MPS together always equal 1.
\[MPS=s=\frac{\Delta S}{\Delta Y}\]
CBSE: Class 12
Formula: Average Propensity to Consume (APC)
- Ratio of total consumption to total income at a given level of income.
\[APC=\frac{C}{Y}\]
CBSE: Class 12
Formula: Average Propensity to Save (APS)
- Ratio of total saving to total income at a given level of income.
\[APS=\frac{S}{Y}\]
Formula: Saving
-
Saving is the part of income that is not consumed.
Since,
\[S = Y − C\]
then,
\[s = 1 − c\]
CBSE: Class 12
Key Relationship
\[MPC + MPS = 1\]
or
\[s = 1 − c\]
CBSE: Class 12
Tamil Nadu Board of Secondary Education: Class 12
Tamil Nadu Board of Secondary Education: Class 12
45° Line
- Represents all points where income = consumption (\[C=Y\]).
- At this point, savings = 0.
- If the consumption curve is below the 45° line → savings are positive.
- If the consumption curve is above the 45° line → dissaving (spending more than income).
CBSE: Class 12
Example - Country "Imagenia"
- Consumption function: C = 100 + 0.8Y
- Autonomous consumption = 100 (consumption at zero income).
- MPC = 0.8 (out of every ₹100 rise in income, ₹80 is consumed).
- Conclusion:
- If income rises by ₹100, consumption rises by ₹80 and savings rise by ₹20.
CBSE: Class 12
Tamil Nadu Board of Secondary Education: Class 12
National Testing Agency: Class 12
Tamil Nadu Board of Secondary Education: Class 12
National Testing Agency: Class 12
Key Points: Consumption
- The consumption function \[C=\bar{C}+cY\] shows that consumption consists of autonomous consumption and induced consumption.
- Autonomous consumption \[\overline{C}\] is the minimum consumption even when income is zero.
- Induced consumption (\[cY\]) depends on income.
- MPC measures how much of an additional income is spent; its value always lies between 0 and 1 (inclusive).
- MPS measures how much of an additional income is saved; MPC + MPS = 1.
- \[APC=\frac{C}{Y}\] and APS = \[APS=\frac{S}{Y}\] measure average spending and saving relative to income.
- The 45° line is the reference line where income equals consumption and saving is zero.
Test Yourself
Related QuestionsVIEW ALL [17]
Given the following data, find the missing value of 'Government Final Consumption Expenditure' and 'Mixed Income of Self Employed'.
| S.No. | Particulars | Amount (In ₹ crores) |
| (i) | National Income | 71,000 |
| (ii) | Gross Domestic Capital Formation | 10,000 |
| (iii) | Government Final Consumption Expenditure | ? |
| (iv) | Mixed Income of Self Employed | ? |
| (v) | Net Factor Income from Abroad | 1,000 |
| (vi) | Net Indirect Taxes | 2,000 |
| (vii) | Profits | 1,200 |
| (viii) | Wages & Salaries | 15,000 |
| (ix) | Net Exports | 5,000 |
| (x) | Private Final Consumption Expenditure | 40,000 |
| (xi) | Consumption of Fixed Capital | 3,000 |
| (xii) | Operating Surplus | 30,000 |
