Please select a subject first
Advertisements
Advertisements
Write the x-coordinate (abscissa) of the given point.
(0, 5)
Concept: undefined >> undefined
Write the y-coordinate (ordinate) of the given point.
(3, 5)
Concept: undefined >> undefined
Advertisements
Write the y-coordinate (ordinate) of the given point.
(4, 0)
Concept: undefined >> undefined
Write the y-coordinate (ordinate) of the given point.
(2, 7)
Concept: undefined >> undefined
Plot the given points on a graph sheet and check if the points lie on a straight line. If not, name the shape they form when joined in the given order.
(1, 2), (2, 4), (3, 6), (4, 8)
Concept: undefined >> undefined
Plot the given points on a graph sheet and check if the points lie on a straight line. If not, name the shape they form when joined in the given order.
(1, 1), (1, 2), (2, 1), (2, 2)
Concept: undefined >> undefined
Plot the given points on a graph sheet and check if the points lie on a straight line. If not, name the shape they form when joined in the given order.
(4, 2), (2, 4), (3, 3), (5, 4)
Concept: undefined >> undefined
If y-coordinate is 3 times x-coordinate, form a table for it and draw a graph.
Concept: undefined >> undefined
Make a line graph for the area of a square as per the given table.
| Side (in cm) | 1 | 2 | 3 | 4 |
| Area (in cm2) | 1 | 4 | 9 | 16 |
Is it a linear graph?
Concept: undefined >> undefined
Explain the situations represented by the following distance-time graph.

Concept: undefined >> undefined
Explain the situations represented by the following distance-time graph.

Concept: undefined >> undefined
Explain the situations represented by the following distance-time graph.

Concept: undefined >> undefined
Find the coordinates of the vertices of the given figures.

Concept: undefined >> undefined
Study the graph given below of a person who started from his home and returned at the end of the day. Answer the questions that follow.

- At what time did the person start from his home?
- How much distance did he travel in the first four hours of his journey?
- What was he doing from 3 pm to 5 pm?
- What was the total distance travelled by him throughout the day?
- Calculate the distance covered by him in the first 8 hours of his journey.
- At what time did he cover 16 km of his journey?
- Calculate the average speed of the man from (a) A to B (b) B to C.
- At what time did he return home?
Concept: undefined >> undefined
Locate the points A(1, 2), B(4, 2) and C(1, 4) on a graph sheet taking suitable axes. Write the coordinates of the fourth point D to complete the rectangle ABCD.
Concept: undefined >> undefined
Locate the points A(1, 2), B(3, 4) and C(5, 2) on a graph sheet taking suitable axes. Write the coordinates of the fourth point D to complete the rhombus ABCD. Measure the diagonals of this rhombus and find whether they are equal or not.
Concept: undefined >> undefined
Locate the points P(3, 4), Q(1, 0), R(0, 4), S(4, 1) on a graph sheet and write the coordinates of the point of intersection of line segments PQ and RS.
Concept: undefined >> undefined
The graph given below compares the sales of ice creams of two vendors for a week.
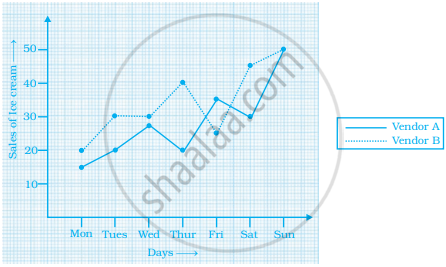
Observe the graph and answer the following questions.
- Which vendor has sold more icecreams on Friday?
- For which day was the sales same for both the vendors?
- On which day did the sale of vendor A increase the most as compared to the previous day?
- On which day was the difference in sales the maximum?
- On which two days was the sales same for vendor B?
Concept: undefined >> undefined
The table given below shows the temperatures recorded on a day at different times.

Observe the table and answer the following questions.
- What is the temperature at 8 am?
- At what time is the temperature 3°C?
- During which hour did the temperature fall?
- What is the change in temperature between 7 am and 10 am?
- During which hour was there a constant temperature?
Concept: undefined >> undefined
The following table gives the growth chart of a child.
| Height (in cm) | 75 | 90 | 110 | 120 | 130 |
| Age (in years) | 2 | 4 | 6 | 8 | 10 |
Draw a line graph for the table and answer the questions that follow.
- What is the height at the age of 5 years?
- How much taller was the child at the age of 10 than at the age of 6?
- Between which two consecutive periods did the child grow more faster?
Concept: undefined >> undefined
