Advertisements
Advertisements
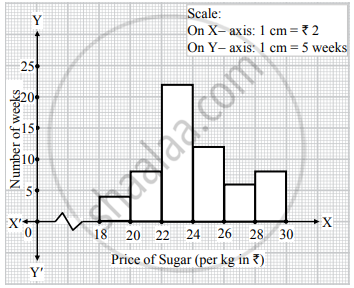
प्रश्न
Represent the following data by histogram:
| Price of Sugar (per kg in ₹) | Number of Weeks |
| 18 – 20 | 4 |
| 20 – 22 | 8 |
| 22 – 24 | 22 |
| 24 – 26 | 12 |
| 26 – 28 | 6 |
| 28 – 30 | 8 |
Advertisements
उत्तर
APPEARS IN
संबंधित प्रश्न
For which of these would you use a histogram to show the data?
(a) The number of letters for different areas in a postman’s bag.
(b) The height of competitors in an athletics meet.
(c) The number of cassettes produced by 5 companies.
(d) The number of passengers boarding trains from 7:00 a.m. to 7:00 p.m. at a station.
Give reasons for each.
A Mathematics aptitude test of 50 students was recorded as follows:
| Marks | 50 - 60 | 60 - 70 | 70 - 80 | 80 - 90 | 90 – 100 |
| No. of Students | 4 | 8 | 14 | 19 | 5 |
Draw a histogram from the above data using a graph paper and locate the mode.
Observe the following frequency polygon and write the answers of the questions below it.
- Which class has the maximum number of students?
- Write the classes having zero frequency.
- What is the class-mark of the class, having frequency of 50 students?
- Write the lower and upper class limits of the class whose class mark is 85.
- How many students are in the class 80-90?
In a hypothetical sample of 20 people the amounts of money with them were found to be as follows:
114, 108, 100, 98, 101, 109, 117, 119, 126, 131, 136, 143, 156, 169, 182, 195, 207, 219, 235, 118.
Draw the histogram of the frequency distribution (taking one of the class intervals as 50 − 100).
Find the lower quartile, the upper quartile, the interquartile range and the semi-interquartile range for the following frequency distributions:
| Variate | 10 | 11 | 12 | 13 | 14 | 15 | 16 | 17 | 18 | 19 | 20 |
| Frequency | 1 | 2 | 3 | 1 | 2 | 4 | 2 | 1 | 1 | 2 | 1 |
Construct histograms for following frequency distribution:
| Class Interval | 110-119 | 120-129 | 130-139 | 140-149 | 150-159 |
| Frequency | 15 | 23 | 30 | 20 | 16 |
Construct a frequency polygon without using a histogram for the following frequency distribution :
| Class Interval | 10-20 | 20-40 | 40-60 | 60-80 | 80-100 |
| Frequency | 9 | 17 | 15 | 20 | 14 |
Draw the Histogram and hence, the frequency polygon for the following frequency distribution:
| House Rent (In ₹ per month) | 400-600 | 600-800 | 800-1000 | 1000-1200 |
| Number of families | 200 | 240 | 300 | 50 |
Following table present educational level (middle stage) of females in Arunachal pradesh according to 1981 census:
| Age group | Number of females (to the nearest ten) |
| 10 - 14 | 300 |
| 15 - 19 | 980 |
| 20 - 24 | 800 |
| 25 - 29 | 380 |
| 30 - 34 | 290 |
Draw a histogram to represent the above data.
Draw a histogram to represent the following data:
| Pocket money in ₹ | No. of Students |
| 150 - 200 | 10 |
| 200 - 250 | 5 |
| 250 - 300 | 7 |
| 300 - 350 | 4 |
| 350 - 400 | 3 |
Identify the following data can be represented in a histogram?
The number of mountain climbers in the age group 20 to 60 in Tamil Nadu.
In a village, there are 570 people who have cell phones. An NGO survey their cell phone usage. Based on this survey a histogram is drawn
How many people use the cell phone for less than 3 hours?
Draw a histogram for the given frequency distribution
| Age | 41 − 45 | 46 − 50 | 51 − 55 | 56 − 60 | 61 − 65 | 66 − 70 | 71 − 75 |
| Frequency | 4 | 9 | 17 | 25 | 15 | 8 | 2 |
Draw a histogram for the following data.
| Mid Value (x) | 15 | 25 | 35 | 45 | 55 | 65 | 75 |
| Frequency (f) | 12 | 24 | 30 | 18 | 26 | 10 | 8 |
In a histogram ______ are drawn with width equal to a class interval without leaving any gap in between.
From the histogram given on the right, we can say that 1500 males above the age of 20 are literate.

Draw a histogram to represent the frequency distribution in question 91.
The below histogram shows the number of literate females in the age group of 10 to 40 years in a town.

- Write the classes assuming all the classes are of equal width.
- What is the classes width?
- In which age group are literate females the least?
- In which age group is the number of literate females the highest?
Use graph paper for this question. Estimate the mode of the given distribution by plotting a histogram. [Take 2 cm = 10 marks along one axis and 2 cm = 5 students along the other axis]
| Daily wages (in ₹) | 30 - 40 | 40 - 50 | 50 - 60 | 60 - 70 | 70 - 80 |
| No. of Workers | 6 | 12 | 20 | 15 | 9 |
The table given below shows the runs scored by a cricket team during the overs of a match.
| Overs | Runs scored |
| 20 – 30 | 37 |
| 30 – 40 | 45 |
| 40 – 50 | 40 |
| 50 – 60 | 60 |
| 60 – 70 | 51 |
| 70 – 80 | 35 |
Use graph sheet for this question.
Take 2 cm = 10 overs along one axis and 2 cm = 10 runs along the other axis.
- Draw a histogram representing the above distribution.
- Estimate the modal runs scored.
