Topics
Physical World and Measurement
Units and Measurements
- The International System of Units (SI)
- Measurement of Length
- Accuracy, Precision and Least Count of Measuring Instruments
- Errors in Measurements>Systematic Errors
- Significant Figures
- Dimensions of Physical Quantities
- Dimensional Formulae and Dimensional Equations
- Dimensional Analysis and Its Applications
- Need for Measurement
- Units of Measurement
- Derived Quantities and Units
- Length, Mass and Time Measurements
- Introduction of Units and Measurements
Physical World
Kinematics
Motion in a Straight Line
- Position, Path Length and Displacement
- Average Velocity
- Instantaneous Velocity
- Instantaneous Speed
- Kinematic Equations for Uniformly Accelerated Motion
- Acceleration in Linear Motion
- Elementary Concept of Differentiation and Integration for Describing Motion
- Uniform and Non-uniform Motion
- Uniformly Accelerated Motion
- Position-time, Velocity-time and Acceleration-time Graphs
- Position - Time Graph
- Relations for Uniformly Accelerated Motion (Graphical Treatment)
- Introduction of Motion in One Dimension
- Motion in a Straight Line
Laws of Motion
Motion in a Plane
- Vector Analysis
- Multiplication of Vectors by a Real Number or Scalar
- Vector Operations>Addition and Subtraction of Vectors
- Resolution of Vectors
- Vector Addition – Analytical Method
- Motion in a Plane
- Equations of Motion in a Plane with Constant Acceleration
- Uniform Circular Motion (UCM)
- Vector
- Instantaneous Velocity
- Rectangular Components
- Scalar (Dot) and Vector (Cross) Product of Vectors
- Relative Velocity in Two Dimensions
- Cases of Uniform Velocity
- Cases of Uniform Acceleration Projectile Motion
- Acceleration in Linear Motion
- Angular Velocity
- Introduction of Motion in One Dimension
Laws of Motion
- Aristotle’s Fallacy
- The Law of Inertia
- Newton's First Law of Motion
- Newton’s Second Law of Motion
- Newton's Third Law of Motion
- Conservation of Momentum
- Equilibrium of a Particle
- Common Forces in Mechanics
- Circular Motion and Its Characteristics
- Solving Problems in Mechanics
- Types of Friction>Kinetic Friction
- Laws of Friction
- Inertia
- Concept of Force
- Dynamics of Uniform Circular Motion - Centripetal Force
- Examples of Circular Motion (Vehicle on a Level Circular Road, Vehicle on a Banked Road)
- Lubrication - (Laws of Motion)
- Law of Conservation of Linear Momentum and Its Applications
- Types of Friction>Rolling Friction
- Introduction of Motion in One Dimension
Work, Energy and Power
Motion of System of Particles and Rigid Body
Work, Energy and Power
- Introduction of Work, Energy and Power
- Notions of Work and Kinetic Energy: the Work-energy Theorem
- Mechanical Energy > Kinetic Energy (K)
- Types of Forces>Work Done by a Variable Force
- Concept of Work
- Mechanical Energy > Potential Energy (U)
- Conservation of Mechanical Energy
- Potential Energy of a Spring
- Concept of Power
- Collisions
- Types of Forces>Conservative and Non-Conservative Forces
Gravitation
System of Particles and Rotational Motion
- Motion - Rigid Body
- Centre of Mass>Mathematical Understanding of Centre of Mass
- Motion of Centre of Mass
- Linear Momentum of a System of Particles
- Angular Velocity and Its Relation with Linear Velocity
- Torque and Angular Momentum
- Equilibrium of Rigid Body
- Moment of Inertia
- Theorems of Perpendicular and Parallel Axes
- Kinematics of Rotational Motion About a Fixed Axis
- Dynamics of Rotational Motion About a Fixed Axis
- Angular Momentum in Case of Rotation About a Fixed Axis
- Rolling Motion
- Momentum Conservation and Centre of Mass Motion
- Centre of Mass of a Rigid Body
- Centre of Mass of a Uniform Rod
- Rigid Body Rotation
- Equations of Rotational Motion
- Comparison of Linear and Rotational Motions
- Values of Moments of Inertia for Simple Geometrical Objects (No Derivation)
Properties of Bulk Matter
Gravitation
- Kepler’s Laws
- Newton's Universal Law of Gravitation
- The Gravitational Constant
- Acceleration Due to Gravity of the Earth
- Acceleration Due to Gravity Below and Above the Earth's Surface
- Variation in the Acceleration>Variation in Gravity with Altitude
- Expression for Gravitational Potential Energy
- Escape Speed
- Earth Satellites
- Binding Energy of an Orbiting Satellite
- Geostationary and Polar Satellites
- Weightlessness
- Escape Velocity
- Orbital Velocity of a Satellite
Thermodynamics
Mechanical Properties of Solids
Mechanical Properties of Fluids
- Thrust and Pressure
- Pascal’s Law
- Variation of Pressure with Depth
- Atmospheric Pressure and Gauge Pressure
- Hydraulic Machines
- Streamline and Turbulent Flow
- Applications of Bernoulli’s Equation
- Viscous Force or Viscosity
- Reynold's Number
- Surface Tension
- Effect of Gravity on Fluid Pressure
- Terminal Velocity
- Critical Velocity
- Excess of Pressure Across a Curved Surface
- Introduction of Mechanical Properties of Fluids
- Archimedes' Principle
- Stoke's Law
- Continuous and Discontinuous Functions
- Torricelli's Law
Behaviour of Perfect Gases and Kinetic Theory of Gases
Oscillations and Waves
Thermal Properties of Matter
- Temperature and Heat
- Measurement of Temperature
- Absolute Zero and Absolute Temperature
- Thermal Expansion
- Specific Heat Capacity
- Calorimetry
- Latent Heat
- Conduction
- Convection
- Radiation
- Newton’s Law of Cooling
- Qualitative Ideas of Black Body Radiation
- Wien's Displacement Law
- Stefan's Law
- Anomalous Expansion of Water
- Liquids and Gases
- Thermal Expansion of Solids
- Green House Effect
Thermodynamics
- Thermal Equilibrium
- Measurement of Temperature
- Heat, Internal Energy and Work
- First Law of Thermodynamics
- Specific Heat Capacity
- Thermodynamic State Variables and Equation of State
- Thermodynamic Process
- Heat Engine
- Refrigerators and Heat Pumps
- Entropy and Second Law of Thermodynamics
- Reversible and Irreversible Processes
- Carnot Engine
Kinetic Theory
- Gases and Its Characteristics
- Equation of State of a Perfect Gas
- Work Done in Compressing a Gas
- Introduction of Kinetic Theory of an Ideal Gas
- Interpretation of Temperature in Kinetic Theory
- Law of Equipartition of Energy
- Specific Heat Capacities - Gases
- Mean Free Path
- Kinetic Theory of Gases - Concept of Pressure
- Assumptions of Kinetic Theory of Gases
- RMS Speed of Gas Molecules
- Degrees of Freedom
- Avogadro's Number
Oscillations
- Periodic and Oscillatory Motion
- Simple Harmonic Motion (S.H.M.)
- Simple Harmonic Motion and Uniform Circular Motion
- Velocity and Acceleration in Simple Harmonic Motion
- Force Law for Simple Harmonic Motion
- Energy in Simple Harmonic Motion
- Some Systems Executing Simple Harmonic Motion
- Damped Simple Harmonic Motion
- Forced Oscillations and Resonance
- Displacement as a Function of Time
- Periodic Functions
- Oscillations - Frequency
- Simple Pendulum
Waves
- Reflection of Transverse and Longitudinal Waves
- Displacement Relation for a Progressive Wave
- The Speed of a Travelling Wave
- Principle of Superposition of Waves
- Introduction of Reflection of Waves
- Standing Waves and Normal Modes
- Beats
- Doppler Effect
- Wave Motion
- Speed of Wave Motion
Estimated time: 3 minutes
Maharashtra State Board: Class 11
Key Points: Position-time, Velocity-time and Acceleration-time Graphs
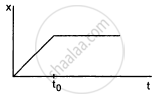
- Slope of x-t graph = Velocity → Horizontal line (x = constant) = rest; positive slope = uniform velocity along +X axis; negative slope = motion along −X axis; curve = non-uniform velocity.
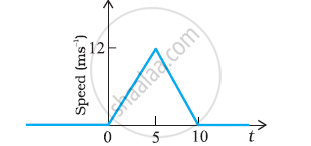
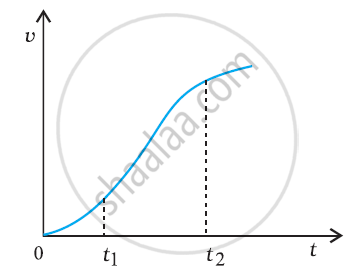
- Slope of v-t graph = Acceleration → Horizontal line = zero acceleration (constant velocity); positive slope = constant positive acceleration; negative slope = constant negative acceleration; curve = non-uniform acceleration.
- Area under v-t graph = Displacement of the object during that time interval.
- x-t graph shapes → Zigzag/oscillatory curve = oscillatory motion with constant speed; ever-increasing curve = accelerated (non-uniform) motion.
- Relative Velocity → \[\vec v_{AB}\] = \[\vec v_A\] − \[\vec v_B\] and \[\vec v_{BA}\] = \[\vec v_B\] − \[\vec v_A\]; they are always equal in magnitude and opposite in direction.
Shaalaa.com | Straight line motion Part 4 (Distance time graph)
to track your progress