Advertisements
Online Mock Tests
Chapters

Advertisements
Solutions for Chapter 2: Population : Part - 2
Below listed, you can find solutions for Chapter 2 of Maharashtra State Board Balbharati for Geography [English] Standard 12 Maharashtra State Board.
Balbharati solutions for Geography [English] Standard 12 Maharashtra State Board 2 Population : Part - 2 Intext Questions [Pages 12 - 20]
Try this.
In fig. 2.1, A, B, C are three population pyramids. Study their shapes and answer the following questions:
- In which pyramid(s) the number of children will be the least?
- In which pyramid(s) the number of old people will be the least?
- Which pyramid(s) represent(s) a 'young country'?
- Which pyramid(s) represent(s) a country with high medical expenditure?
- Which pyramid(s) represent(s) a country with a large manpower?
- Which pyramid(s) represent(s) developing and developed countries respectively?
Can you tell?
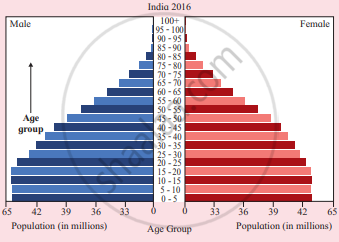
Population pyramid of India is given in the fig. Read the pyramid and answer the following questions:
- Which pyramid type does India belong to?
- Comment upon the age-structure of its population.
Give it a try.
On the basis of the survey done in practical 1, draw a population pyramid for the people in 15 households. Write your conclusions after studying the structure of the population.
Find out !
Find out India's sex ratio as per Census 2011.
Can you tell?
Read the following table and answer the questions that follow:
India - Demographic Dividend
| Decade | Ratio of working/ non-working population | Percentage of working population |
| 2001-10 | 1.33 : 1 | 57.1 |
| 2011-20 | 1.53 : 1 | 60.5 |
| 2021-30 (projected) | 1.81 : 1 | 64.4 |
| 2031-40 (projected) | 1.72 : 1 | 63.2 |
- What does the table show?
- What is the relationship between second and third column?
- How will this relationship affect the economy of India?
- What will happen if the ratio decreases over the years?
Try this.
Answer the questions after studying table carefully:
| Country | Retirement Age reforms being implemented or under consideration (in years) |
|---|---|
| Germany | Retirement age to increase gradually to 66 by 2023 and to 67 by 2029 |
| United States of America | Retirement age to rise gradually to reach 67 for those born in 1960 or later |
| United Kingdom | Retirement age to increase for both men and women to 66 by October 2020 and further to 67 between 2026–28 |
| Australia | Retirement age scheduled to increase gradually to 67 by 2023 |
| China | By 2045, to increase retirement age for both men and women to 65 |
| Japan | Under consideration to raise the retirement age to 70 |
| India | On an average, 60 years. May vary from 55 years to 65 years according to services |
- What does the table show?
- Classify these countries into developed and developing.
- What could be the reasons behind increasing the retirement age in these countries?
- What will be the impact of increase in the retirement age on the economy of the respective countries?
- Why is China considering increasing the age later in 2045?
- Considering these examples from developed countries, will it be good for India to increase its retirement age? Express your views about this.
- Write a concluding statement about the relationship between age structure, life expectancy and economy of a country.
Find out !
Find out the minimum age taken into consideration for calculating literacy.
- Brazil
- USA
- Germany
Can you tell?
Observe the following graph and answer the question given below.

- Which region has the highest literacy rate?
- Which region has the lowest literacy rate?
- In which region does women fare better than men in literacy rate?
- Write a concluding paragraph about the graph.
- What does this graph tells us?
Give it a try.
Study the table carefully and answer the following questions:
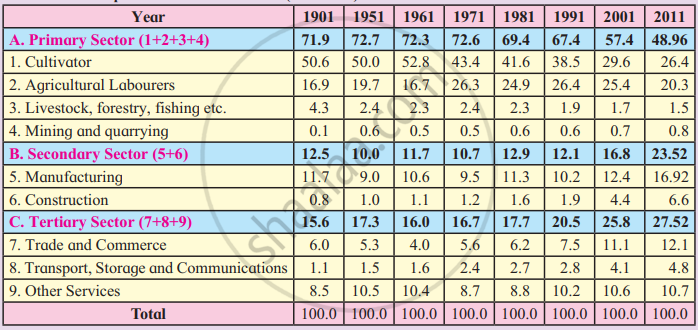
- What does the table show?
- Which sector has the highest occupation? In which year?
- Which sector has the lowest occupation? In which year?
- In which sector is the working population increasing?
- In which sector is the working population occupation decreasing?
- Draw a suitable diagram for statistical information showing A, B and C columns from 1901-2011
- Compare the data. Write a concluding paragraph on the graph.
Can you tell?
On the basis of which other characteristics can you explain the composition of population? Make a list.
Try this.
You have already made a list of the reasons why migration occurs. Add more reasons to it. Discuss it in the classroom. Classify these reasons into pull and push factors and complete the figure. Use the given space or complete it in your notebook.

Use your brain power !
If you travel to a place for a few days with your family, will it be considered migration?
Try this.
Complete the table, which shows the impact of migration on the population. One is solved as example.
| Sr. No. | Type of migration | Positive effects | Negative effects |
|---|---|---|---|
| 1 | International migration | Employment is available to migrants. Improves their financial status. | Resources are affected. Sometimes, they might be sent back to their original country. |
| 2 | Internal migration | ||
| a | Rural to urban migration | ||
| b | Urban to rural migration | ||
| c | Rural to rural migration | ||
| d | Urban to urban migration | ||
| 3 | Seasonal / temporary migration |
Balbharati solutions for Geography [English] Standard 12 Maharashtra State Board 2 Population : Part - 2 Exercise [Page 20]
Identify the correct co-relation: A: Assertion; R: Reasoning
A: Assertion: Increase in the dependency ratio will affect the economy.
R: Reasoning: Medical costs are high when there are more elderly in the population.
Only A is correct
Only R is correct
Both A and R are correct and R is the correct explanation of A.
Both A and R are correct but R is not the correct explanation of A.
A: Assertion: In the population pyramid, a broad base indicates a high number of children in a country.
R: Reasoning: Broad apex is an indicator of the high number of elderly in a country
Only A is correct
Only R is correct
Both A and R are correct and R is the correct explanation of A.
Both A and R are correct but R is not the correct explanation of A.
Write a short note on :
Population growth and migration.
Write a short note on:
Population pyramid and sex ratio.
Write a short note on:
Occupational structure of a population.
Write a short note on literacy rate.
Give a geographical reason:
In developed countries, the percentage of the population engaged in agriculture is low.
Give geographical reasons:
Literacy rate of a country is an indicator of its socio-economic development.
Give a geographical reason:
Demographic dividend increases when the proportion of the working population increases.
Give a geographical reason:
Migration is not always permanent.
Differentiate between donor region and recipient region.
Differentiate between:
Expansive population pyramid and Constrictive population pyramid.
Answer in detail :
Outline the importance of population pyramids in the study of populations.
Answer in detail:
Explain the rural and urban population structure.
Answer in detail:
Examine the impact of migration on the population structure of a country.
Solutions for 2: Population : Part - 2
Balbharati solutions for Geography [English] Standard 12 Maharashtra State Board chapter 2 - Population : Part - 2
Shaalaa.com has the Maharashtra State Board Mathematics Geography [English] Standard 12 Maharashtra State Board Maharashtra State Board solutions in a manner that help students grasp basic concepts better and faster. The detailed, step-by-step solutions will help you understand the concepts better and clarify any confusion. Balbharati solutions for Mathematics Geography [English] Standard 12 Maharashtra State Board Maharashtra State Board 2 (Population : Part - 2) include all questions with answers and detailed explanations. This will clear students' doubts about questions and improve their application skills while preparing for board exams.
Further, we at Shaalaa.com provide such solutions so students can prepare for written exams. Balbharati textbook solutions can be a core help for self-study and provide excellent self-help guidance for students.
Concepts covered in Geography [English] Standard 12 Maharashtra State Board chapter 2 Population : Part - 2 are Overview of Population : Part - 2, Population Composition, Migration, Reasons for Migration, Impact of Migration on Population.
Using Balbharati Geography [English] Standard 12 Maharashtra State Board solutions Population : Part - 2 exercise by students is an easy way to prepare for the exams, as they involve solutions arranged chapter-wise and also page-wise. The questions involved in Balbharati Solutions are essential questions that can be asked in the final exam. Maximum Maharashtra State Board Geography [English] Standard 12 Maharashtra State Board students prefer Balbharati Textbook Solutions to score more in exams.
Get the free view of Chapter 2, Population : Part - 2 Geography [English] Standard 12 Maharashtra State Board additional questions for Mathematics Geography [English] Standard 12 Maharashtra State Board Maharashtra State Board, and you can use Shaalaa.com to keep it handy for your exam preparation.
